


Sign up to create alerts for Instruments,
Economic Events and content by followed authors
Free Sign Up Already have an account? Sign In
Please try another search

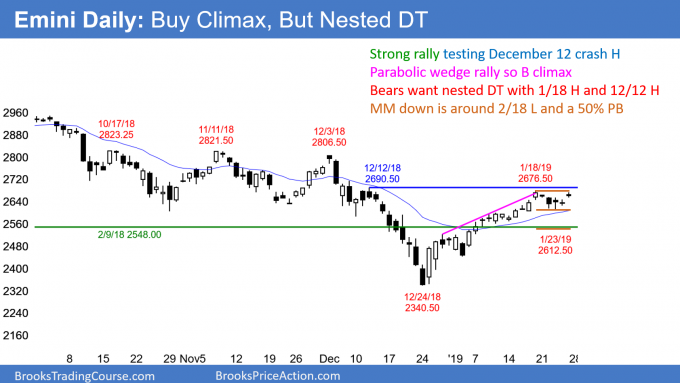
The emini daily chart has rallied for five weeks in a parabolic wedge buy climax. It is now in a resistance zone. Traders are deciding whether there will be one more small leg up before beginning a test of last February’s low and 2,500.
The 30-year bond futures daily chart is completing its first leg down from a wedge top buy climax. Traders will sell any rally in the next couple of weeks, expecting a second leg down.
The EUR/USD weekly Forex chart has been in a tight trading range for 13 weeks. It will probably break out in February and have a 200 – 300 pip measured move up or down.
The December rally on the US 30 Year Bond Futures chart was strong. However, it was in a wedge bull channel. In addition, it ended with a climactic reversal down from above the top of the channel. When that happens, the bulls typically wait for at least a couple legs down before buying again.
A common target is the first pullback at the bottom of the wedge. Traders therefore expect that the first rally will fail and form a lower high. They will then look for a test of the December 13 low.
However, it is doing it by going sideways in a tight trading range. It is therefore still in breakout mode. The EUR/USD daily Forex chart has been in a tight trading range for 13 weeks. It is therefore in breakout mode. Traders expect either a 200 – 300 pip measured move up or down.
This week is a buy signal bar. However, until there is a breakout, there is no breakout. Because of the wedge bottom, the odds are slightly better for the bulls. But, the probability is still close to 50% for the bulls and for the bears.
All of the trading ranges over the past year broke out within a couple of months. Consequently, the odds are that this one will breakout within the coming month.
Traders are probably waiting for more information about Brexit before buying or selling aggressively. Until then, they are taking small trades up and down and exiting every few days.
The monthly S&P500 Emini futures chart has a big bull inside bar so far in January. The current close is near the 20-month EMA. Since the chart was above the 20-month EMA for more than 20 months, that is support. That is one of the reasons why January reversed up so strongly.
Support is a magnet. December fell far below that support, tested the lower support of the eight-year bull trend line, and reversed up strongly back to the EMA support.
As strong as the reversal up has been on the daily and weekly charts, it is only a single bar on the monthly chart. In addition, it still is much smaller than the big bear bar in December. Furthermore, it has retraced only about half of the three-month selloff.
While January has been good for the bulls, they have not erased the damage created by the bears. Therefore, the chart is still good for the bears. A Big Down move followed by a Big Up move creates Big Confusion.
When traders are confused, they are confident of only one thing… that the market will probably not go too far up or down. The price is just about right. They therefore buy selloffs and scale in lower. In addition, they sell rallies and scale in higher. Because they expect reversals, they take quick profits and do not hold on, hoping for a trend. The result is a trading range.
The monthly chart has been in a trading range for a year. It is now back to the middle of the range. While January is buy signal bar for February, the selloff is so strong that a rally from here would probably be minor. Most likely, the trading range will continue for several more months, and possibly all year.
This is true even if there is a new high or a break below the December low. Trading ranges resist breaking out. A reversal back into the range is more likely than a new trend.
A strong bull bar in January is no better for the bulls than the big bear bar in December was for the bears. There is no breakout until there is a clear breakout. There is nothing on the monthly chart to indicate that a breakout will come soon.
The weekly S&P500 Emini futures chart reversed up strongly from the December crash down to the eight-year bull trend line. This week was a bull doji inside bar. Just as the Emini got vacuumed down to the eight-year bull trend line, it got vacuumed back up to the 20-week EMA. Despite four strong bull trend bars, the rally stopped exactly at the 20-week EMA.
This week was a small bull doji inside bar. Because the weekly chart has had a strong selloff and a lower high and low, it is in an early bear trend. The bears are hoping that the rally over the past five weeks is simply a bear rally up to the EMA.
And it might be. But, when a rally is very strong, the first reversal down typically fails. The bears usually want at least a small double top before they will sell aggressively again. Consequently, if next week trades below this week’s low, the selloff will probably not get far nor last long.
Because bears want a micro double top, there will probably be more buyers than sellers below this week’s low. Any reversal down next week will more likely be a pullback from the 4-week rally than a resumption of the bear trend.
But, if the bulls get a second leg up after the pullback, the bears will be more willing to sell a test of last week’s high. Remember, most bears want a micro double top. They will therefore sell a test back up to last week’s high, hoping to get a second reversal down. That would be a higher probability sell signal.
Because this week is an inside bar in a four-week rally, it is a High 1 bull flag. But, it only has a small bull body and it closed below the 20-week EMA. In addition, the EMA is falling and it is therefore resistance. This week is a weak buy signal bar and the location is bad. Just as there are probably buyers below this week’s low, there are probably sellers above this week’s high. As a result, the Emini will probably not go very far up or down over the next week.
The December 12 high is the top of the stock market crash and a magnet above. The bears have a small double top with the January 18 high and a bigger double top with the December 12 high.
I wrote during the December crash that there would be a rally strong enough to make traders wonder if the bull trend has resumed. That has been the case. Markets spend most of their time in balance, and less time probing up and down.
The daily S&P500 Emini futures chart pulled back this week after a strong four-week rally. That rally had three legs up in a tight bull channel. It is therefore a parabolic wedge buy climax. A buy climax creates exhausted bulls.
Since the protective stop for the bulls is now far below, they have unusually big risk. Institutional risk managers are demanding that their traders reduce risk. The easiest way is to take some profits on their longs. This long liquidation created the four-day pullback this week. After a parabolic wedge buy climax, the pullback often lasts about ten days.
There has not yet been a strong reversal down. Consequently, there is no consensus that the high is in. Traders need to see one or more big bear bars before concluding that the bulls have given up and the Emini might be testing the December low.
Because the bulls have not yet given up, there might be one more leg up. The December 12 lower high was the top of the December stock market crash. Since there are theoretically weak bears with stops above that high, it is a magnet.
There is currently a 50% chance that the four-day selloff is the start of a correction down from the four-week rally. There is also a 50% chance of a test of the December 12 high of 2,690.50 and the 2,700 Big Round Number before there is a correction down from the rally.
How far down can the Emini fall? A Big Down, Big Up move creates Big Confusion. Confusion typically results in a trading range. A trading range has legs up and down, which can be big and fast. The odds favor a test back down.
At a minimum, traders expect a selloff that retraces at least a third of the rally from the December low. A reversal back up from there or from lower would create a major trend reversal. A major reversal has a 40% chance of becoming a bull trend. There is a 60% chance of either a trading range or a continuation of the bear trend.
Corrections usually are about 50%. Since the December selloff was so strong, once the correction comes, it will probably retrace at least half of the rally.
Can the bears get a strong break below the December low? Not likely. If the Emini tests down to around the December low, many stocks will fall below their December lows. AAPL, FB, MS, GOOGL, M, DAL, PFE, JNJ, and XOM have not rallied strongly and are more likely to make a new low if the Emini has a sharp test of the December low.
However, many others have had very strong rallies. Examples include AMZN, JPM, NKE, MCD, BA, AMGN, and NFLX. A selloff in those stocks will probably form higher lows.
When many stocks form a new low and many others form a higher low, there is a divergence. The lack of consistency weakens the bear case. Therefore, the odds at the moment are against the Emini breaking far below the December low.
More likely, any selloff will form a double bottom with the December low. It can be very asymmetrical, with the second bottom far above or below the December low.
However the test down looks, there would then probably be a test back up to the top of the January or February rally. The bears will try to create a double top. The January or February top of the current rally will be the neck line of the double bottom. The bulls will therefore hope for a breakout and a measured move up. That would result in a test of the all-time high.
What is most likely? Disappointment. The Emini is in a trading range. Trading ranges resist breaking out. There are many strong rallies and selloffs. Each looks like the start of a new trend.
But there is no follow-through. The trend traders are disappointed and exit. The result is that reversals are more common than breakouts when the market is in a trading range. Confusion and disappointment are the two hallmarks of a trading range.
When present, as they are now, the chart is usually in a trading range. Trading ranges often last much longer than what seems likely. This is especially true when the buy climax was the most extreme in history, as it was in 2017.
Many believe Winston Churchill coined the phrase: “Never let a good crisis go to waste.” Others think it was President Obama’s Chief of Staff, Rahm Emanual, who said, “You...
DOGE is unlikely to cause a US recession, but its "move fast and break things" approach raises the risks. Narratives about the U.S. economic outlook have darkened in the past...
MON: Eurogroup Meeting, Norwegian CPI (Feb), EZ Sentix Index (Mar), Japanese GDP (Q4) TUE: EIA STEO WED: 25% US tariff on all imports of steel and aluminium comes into effect,...
Are you sure you want to block %USER_NAME%?
By doing so, you and %USER_NAME% will not be able to see any of each other's Investing.com's posts.
%USER_NAME% was successfully added to your Block List
Since you’ve just unblocked this person, you must wait 48 hours before renewing the block.
I feel that this comment is:
Thank You!
Your report has been sent to our moderators for review


Add a Comment
We encourage you to use comments to engage with other users, share your perspective and ask questions of authors and each other. However, in order to maintain the high level of discourse we’ve all come to value and expect, please keep the following criteria in mind:
Enrich the conversation, don’t trash it.
Stay focused and on track. Only post material that’s relevant to the topic being discussed.
Be respectful. Even negative opinions can be framed positively and diplomatically. Avoid profanity, slander or personal attacks directed at an author or another user. Racism, sexism and other forms of discrimination will not be tolerated.
Perpetrators of spam or abuse will be deleted from the site and prohibited from future registration at Investing.com’s discretion.