- All Instrument Types
- Indices
- Equities
- ETFs
- Funds
- Commodities
- Currencies
- Crypto
- Bonds
- Certificates
Please try another search

Breaking News
Earnings Season In The Final Stretch

Earnings Season in the Last Stretch
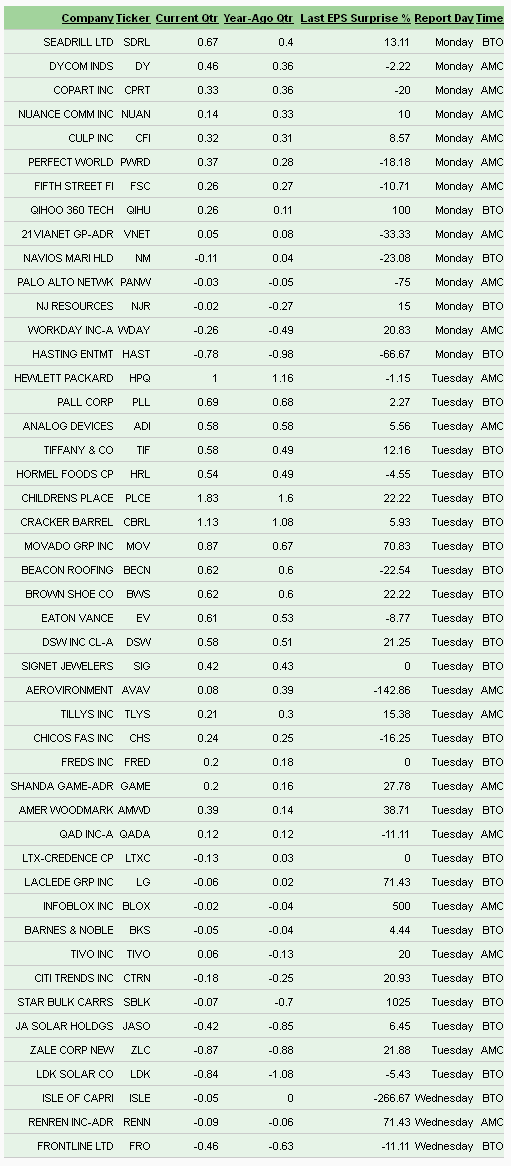
We don’t have much in terms of earnings releases this Thanksgiving Day week, but we still have 47 companies releasing results, including 5 S&P 500 members. The Q3 earnings season is mostly over, with results from 489 S&P 500 members, or 97.8% of the index’s total membership, already known. Most of this week’s reports are coming out on Tuesday, including Hewlett-Packard (HPQ), Tiffany (TIF), and Hormel Foods (HRL). By the end of this week, we will have seen Q3 results from 494 of the S&P 500 members.
Our overall verdict on the Q3 earnings season is favorable, particularly relative to the last few quarters. The fact that actual results have been better relative to the lowered pre-season expectations is no surprise given management team’s impressive track record in under-promising and over-delivering. There is still not much growth and most companies are still guiding lower, prompting estimates for Q4 to come down. But whatever little growth we have in Q3 thus far is better than we have seen in recent quarters. And for those keeping records, the Q3 earnings season appears on track a new quarterly record for total earnings, surpassing the level achieved in Q2.
The Retail sector has been in focus lately, with the broadly underwhelming guidance from Wal-Mart (WMT), Target (TGT), Best Buy (BBY) and others pointing towards a soft holiday shopping season for the sector. Even before the earnings reports from these retailers, we knew that consumer spending growth had decelerated in Q3. We know that in the Q3 GDP report personal consumption expenditures were up only +1.5%, down from Q2’s +1.8% growth pace. A low-growth environment forces retailers to rely on promotional efforts to grab more consumer dollars. But this zero-sum drive for market share where one company’s gain is another’s loss typically drives down margins for everyone.
Looked at this way, Wal-Mart’s sub-par outlook may not solely be a function of under-pressured household finances, but also reflective of a hyper competitive retail environment where some operators like Amazon (AMZN) are more than willing to sacrifice margins for more sales. Wal-Mart referred to this competitive dynamic in their earnings call, which apparently more than offset the beneficial effects of recent downtrend in gasoline prices.
Q3 Earnings Scorecard (as of Friday, 11/22/2013)
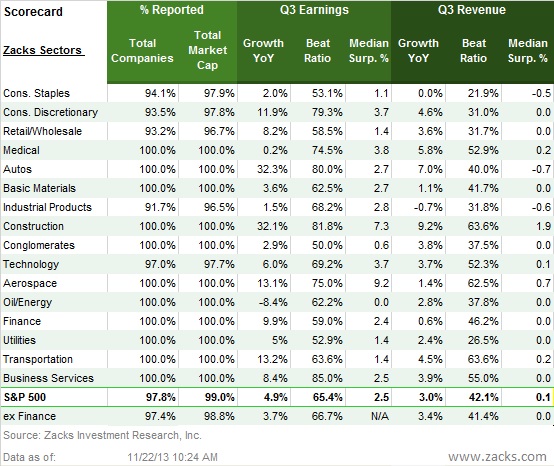
Total earnings for the 489 S&P 500 companies that have reported results are up +4.9% with 65.4% beating earnings expectations, while total revenues for these companies are up +3.0% and 42.1% are beating top-line expectations. The table below shows the current earnings scorecard.

This is better performance than what this same group of 489 companies reported in Q2 and the 4-quarter average. As you can see in the chart below, the earnings and revenue growth rates for these companies is notably better than what we saw from this same group of companies in Q2 and the 4-quarter average.

Unlike recent quarters, The Finance sector isn’t driving growth in Q3. Total earnings growth outside of Finance of +3.7% compares to earnings decline of -2.0% in Q2 and the average -0.4% decline in the preceding four quarters. Improved growth at the Technology, Basic Materials, and Transportation sectors accounts for the positive ex-Finance variance in Q3 relative to the recent past.
Total earnings for the 97.0% of the Technology sector’s market capitalization that have reported results already are up +6.0% from the same period last year, which compares to earnings declines of -8.9% in Q2 and the 4-quarter average of -1.6%.
At the medium industry level (or M level), we have 7 industries in the Technology sector, of which only Telecom Services hasn’t reported any results yet. The growth picture has improved for each of the other six industries, with the improvement particularly notable for the Software & Services and Semiconductor industries. These two industries combined account for 41% of the sector’s total earnings.
Strong earnings growth at Google (GOOG) and Microsoft (MSFT) accounts for the positive growth profile of the Software & Services industry and account for a big part of the Tech sector’s positive growth picture. Excluding both these companies form the Tech sector’s tally, the sector’s Q3 total earnings growth drops from +6% to +3.3%.
Total earnings for the Computer & Office Equipment industry, the biggest industry in the sector accounting for almost 44% of the sector’s total earnings, are down -1.9% from the same period last year, primarily driven by tough comparisons for Apple (AAPL). But this still better performance than what the industry was able to achieve in recent quarters. Apple’s negative year-over-year comparison has been a big drag on the sector’s growth picture. Excluding Apple, total earnings for the Tech sector would be up +9.9% (up +6% including the company).
Total earnings for the Basic Materials sector are up +3.6% on +1.1% higher revenues. The improvement in the sector’s growth numbers is primarily a function of easy comparisons, particularly in the sector’s dominant chemicals industry (67.6% of total sector earnings come from the Chemicals & Fertilizer industry). The Chemicals industry earnings are up +11.3% at this stage, largely due to easy comparisons at Dow Chemicals (DOW). Dow missed and guided lower, but its Q3 total earnings were up year over year.
The Composite Growth Picture
Total earnings for the S&P 500 as a whole, combining the results from the 489 that have reported with estimates for the remaining 11, is for growth of +4.7% on +2.9% higher revenues. This compares to +3.7% earnings growth in Q2 on 2.0% revenues.
Only five of the 16 Zacks sectors are expected to have double-digit earnings growth in Q3 – Consumer Discretionary (11.9%), Construction (+32.1%), Transportation (+13.2%), Autos (+32.3%) and Aerospace (+13.1%). Excluding Finance, total earnings for the S&P 500 are expected to be up +3.7% on +3.4% higher revenues, which is up from a decline of -2.0% in total earnings on +1.2% higher revenues in Q2.
Q4 Estimates Coming Down
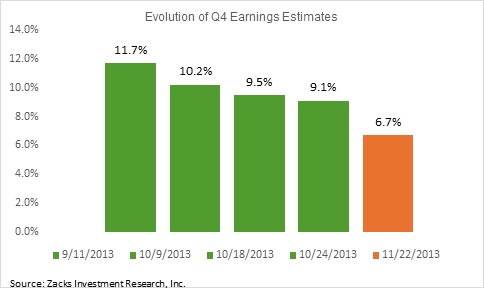
Estimates for Q4 have started coming down, though they still have plenty of room to go before reaching ‘reasonable’ levels. The chart below shows how estimates for Q4 have evolved in recent weeks.

Investors seem to be fine with the current record level of earnings as providing enough justification for the stock market’s all-time record level. We will have wait to see if this justification would work once the Fed starts getting out of the QE, which some suspect could happen as early as this December. But irrespective of when the Fed starts tapering, the stock market needs stronger earnings growth in the coming quarters than we have seen in the recent past to maintain its recent momentum.
Here is a list of the 47 companies reporting this week, including 5 S&P 500 members:

Original post
Related Articles

In a striking reversal of fortunes, equities in developed markets ex-US are now leading the major asset classes in 2025 while US shares are posting a modest loss year to date,...

US index futures broke lower after Marvell Technology's earnings missed. Nasdaq and S&P 500 are now testing key support zones. Meanwhile, Amazon, Oracle, Tesla and...

There was some modest buying today from the open, but volume was light and markets are below trading range support established during the latter part of 2024. It's hard to see...
Are you sure you want to block %USER_NAME%?
By doing so, you and %USER_NAME% will not be able to see any of each other's Investing.com's posts.
%USER_NAME% was successfully added to your Block List
Since you’ve just unblocked this person, you must wait 48 hours before renewing the block.
I feel that this comment is:
Thank You!
Your report has been sent to our moderators for review


Add a Comment
We encourage you to use comments to engage with other users, share your perspective and ask questions of authors and each other. However, in order to maintain the high level of discourse we’ve all come to value and expect, please keep the following criteria in mind:
Enrich the conversation, don’t trash it.
Stay focused and on track. Only post material that’s relevant to the topic being discussed.
Be respectful. Even negative opinions can be framed positively and diplomatically. Avoid profanity, slander or personal attacks directed at an author or another user. Racism, sexism and other forms of discrimination will not be tolerated.
Perpetrators of spam or abuse will be deleted from the site and prohibited from future registration at Investing.com’s discretion.