


Sign up to create alerts for Instruments,
Economic Events and content by followed authors
Free Sign Up Already have an account? Sign In
Please try another search

Dollar General Corporation (NYSE:DG) delivered positive earnings surprise for the fourth consecutive quarter, when the company posted third-quarter fiscal 2017 results. The company reported earnings of 93 cents per share. However, on an adjusted basis earnings per share came in at 98 cents, beating the Zacks Consensus Estimate of 94 cents and also increased 10.1% year over year.
Net sales came in at $5,903.6 million, an increase of 11% from the prior-year quarter. Moreover, net sales came ahead the Zacks Consensus Estimate of $5,803 million, marking the fourth consecutive quarter of beat. Increase in sales was driven by robust performance of consumables, seasonal and apparel categories.
The company’s comparable-store sales increased 4.3% year over year primarily owing to rise in average transaction amount as well traffic. Consumables, seasonal and apparel categories provided a boost to the comparable-store sales, while the home products had a negative impact.
Sales in the Consumables category increased 11.8% to $4,625.4 million, while the Seasonal category witnessed a rise of 10.5% in sales to $636.5 million. Home products sales increased 5% to $346.3 million and Apparel category sales grew 6.8% to $295.3 million.
Gross profit advanced 11.3% to $1,766.5 million, while gross margin increased 8 basis points (bps) to 29.9% owing to increased initial inventory markups. Operating rose 6.2% to $417.3 million, while operating margin decreased more than 30 bps to 7.1%.
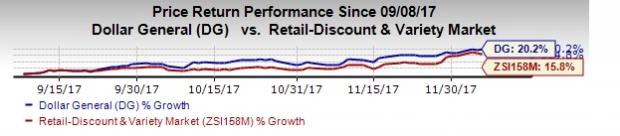
Following the results, the company’s shares are up roughly 4% during pre-market trading session. In fact, the company’s shares have increased 20.2% in the past three months, outperforming the industry’s growth of 15.8%.
Dollar General Corporation Price, Consensus and EPS Surprise
Outlook
Management now anticipates net sales to rise by 7%, compared with earlier estimate of 5-7%. However, the company expects GAAP earnings in the band of $4.37-$4.47 per share, compared with the earlier guided range of $4.35-$4.50. Same-store sales growth is anticipated to be 2.5%, up from the prior projected range of marginally positive to 2% for fiscal 2017.
Moreover, the company intends to introduce roughly 1,285 new outlets, relocate or remodel 760 stores. As of Nov 3, 2017, Dollar General operated 14,321 stores across 44 states.
Zacks Rank & Other Stocks to Consider
Dollar General’s currently carries a Zacks Rank #2 (Buy). Other top-ranked stocks which warrant a look in the retail sector includes Guess?, Inc. (NYSE:GES) , Michael Kors Holdings Limited (NYSE:KORS) and PVH Corp. (NYSE:PVH) . All three stocks carry a Zacks Rank #2. You can see the complete list of today’s Zacks #1 Rank (Strong Buy) stocks here.
Guess has reported better-than-expected earnings in the trailing four quarters, with an average beat of 28.2%.
Michael Kors Holdings has an impressive long-term earnings growth rate of 7.5%. It has also surpassed the Zacks Consensus Estimate in the trailing four quarters, with an average earnings beat of 23.7%.
PVH has reported earnings beat in the trailing four quarters, with an average of 2.6%.
Zacks' Hidden Trades
While we share many recommendations and ideas with the public, certain moves are hidden from everyone but selected members of our portfolio services. Would you like to peek behind the curtain today and view them?
Starting now, for the next month, I invite you to follow all Zacks' private buys and sells in real time from value to momentum...from stocks under $10 to ETF to option movers...from insider trades to companies that are about to report positive earnings surprises (we've called them with 80%+ accuracy). You can even look inside portfolios so exclusive that they are normally closed to new investors.
Click here for Zacks' secret trade>>
In a market fraught with uncertainty, investors often seek refuge in defensive-minded stocks that offer stability and resilience. Two such stalwarts, Johnson & Johnson and...
Bitcoin has gained legitimacy as it has achieved mainstream status these days. Even the United States Securities and Exchange Commission (SEC) has acknowledged its legitimacy with...
Stocks fell sharply, with the S&P 500 leading the decline, finishing the day down almost 1.6% at 5,860. Meanwhile, the Nasdaq 100 dropped nearly 2.75%, closing at 20,550. This...
Are you sure you want to block %USER_NAME%?
By doing so, you and %USER_NAME% will not be able to see any of each other's Investing.com's posts.
%USER_NAME% was successfully added to your Block List
Since you’ve just unblocked this person, you must wait 48 hours before renewing the block.
I feel that this comment is:
Thank You!
Your report has been sent to our moderators for review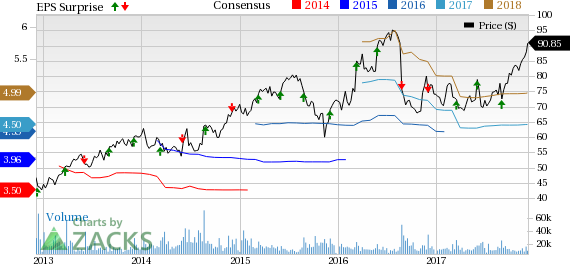

Add a Comment
We encourage you to use comments to engage with other users, share your perspective and ask questions of authors and each other. However, in order to maintain the high level of discourse we’ve all come to value and expect, please keep the following criteria in mind:
Enrich the conversation, don’t trash it.
Stay focused and on track. Only post material that’s relevant to the topic being discussed.
Be respectful. Even negative opinions can be framed positively and diplomatically. Avoid profanity, slander or personal attacks directed at an author or another user. Racism, sexism and other forms of discrimination will not be tolerated.
Perpetrators of spam or abuse will be deleted from the site and prohibited from future registration at Investing.com’s discretion.