

Sign up to create alerts for Instruments,
Economic Events and content by followed authors
Free Sign Up Already have an account? Sign In
Please try another search

Darden Restaurants, Inc. (NYSE:DRI) is set to report second-quarter fiscal 2018 results on Dec 19, before market opens.
Last quarter, the company delivered a positive earnings surprise of 1.02%. In fact, Darden’s earnings surpassed the Zacks Consensus Estimate in each of the last four quarters, with an average beat of 2.29%.
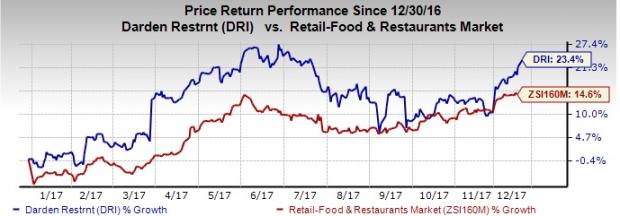
Notably, shares of the company have rallied 23.4% so far this year, outperforming the industry’s growth of 14.6%.
Darden is poised for significant growth on the back of impressive price movement and strong fundamentals.
Top-line Picture Rosy
Darden’s revenues are expected to increase year over year in the to-be-reported quarter driven by various initiatives that include simplifying kitchen systems, operational excellence to enhance guest experience, menu innovation and other technology-driven moves. In fact, the consensus estimate for current-quarter net sales is pegged at $1.9 billion, reflecting 12.7% year-over-year growth. In the first quarter, the company recorded $1.9 billion in total sales from continuing operations, reflecting year-over-year growth of 12.9%.
Coming to the revenue segments, Olive Garden is likely to grow year over year on Brand Renaissance Plan. Also, Olive Garden’s To Go business, which offers online ordering at selected locations, is growing at a rapid pace and is expected to maintain momentum. The consensus estimate for current-quarter net sales at the segment is pegged at $933 million, reflecting 2% year-over-year growth. Comps are expected to increase 0.2% in the to-be-reported quarter. In the first quarter, sales at Olive Garden were up 3% year over year to $989.9 million.
Sales at LongHorn are expected to grow year over year owing to culinary innovation in the segment. Darden is also working on a marketing strategy to improve execution, customer relationship management and digital advertising. Further, the company continues to focus on strengthening its in-restaurant execution through strategic investments in quality.
Such efforts are likely to drive segmental comps in the to-be-reported quarter. The consensus estimate for net sales in the second quarter is pegged at $375 million, reflecting a 2.7% year-over-year growth. In the first quarter the segment’s sales rose 4.7% to $404.5million.
Coming to sales at Fine Dining, consensus estimate for second-quarter comps growth is at 0.1% for Capital Grille and 0.2% for Eddie.
Revenues at Other Business will depend on the company’s follow up on Cheddar’s integration. Comps in the first quarter surpassed industry benchmarks, excluding Darden, but declined 1.4%. Cheddar’s has an extensive presence in Texas which exposed it more to the effects of Hurricane Harvey than Darden. However, the company expects Cheddar’s to perform well in the upcoming quarter.
(See More in How Will Darden Restaurants' (DRI) Top Line Shape Up in Q2?)
Will Darden See Strong Margins?
Darden has an aggressive cost management plan, under which it has significantly cut operating costs. However, in the first quarter, the company incurred increased operating costs and expenses due to the effects of the recent hurricanes. Taking the lingering effects of hurricanes and cost inflation into account, Darden is expected to witness higher costs in the to-be-reported quarter.
In the first quarter, adjusted EBIT was down 10 bps owing to last year’s asset sale gains of $8 million. Moreover, Cheddar’s integration had a 40-bps unfavorable impact on EBIT margin on a year-over-year basis. The company expects a lower impact in the upcoming quarter owing to the completion of this integration.
(Read more in How Will Darden Restaurants' (DRI) Margins Shape Up in Q2?).
EPS Growth to Offset Hurricane-Related Headwinds
Adjusted earnings per share in the second quarter are expected to grow on increased revenues across all brands. The consensus estimates for second-quarter earnings is pegged at 70 cents, reflecting year-over-year growth of 9.7%.
Notably, current-quarter and year earnings estimates for Darden have increased 1.4% and 0.2%, respectively, over the last 60 days.
Meanwhile, management noted that hurricane-related headwinds affected first-quarter earnings by approximately 1.5 cents and are expected to have a greater impact on margins in the second quarter as compared to the first. So, the expected growth in EPS is likely to offset hurricane-related headwinds to some extent.
Our Quantitative Model Suggests a Beat
Please note that according to our quantitative model, a company with a Zacks Rank #1 (Strong Buy), 2 (Buy) or 3 (Hold) and a positive Earnings ESP has a fair chance of beating estimates. Meanwhile, stocks with a Zacks Rank #4 (Sell) or 5 (Strong Sell) are best avoided.
Darden has a Zacks Rank #3 and an Earnings ESP of +1.10%, a combination that increases the odds of a beat. You can uncover the best stocks to buy or sell before they’re reported with our Earnings ESP Filter.
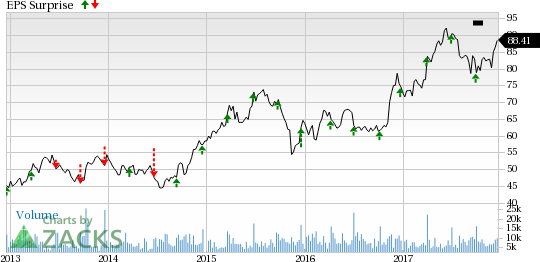
Darden Restaurants, Inc. Price and EPS Surprise | Darden Restaurants, Inc. Quote
Stocks to Consider
Here are some restaurant companies that investors may consider, as our model shows that they have the right combination of elements to post an earnings beat this quarter:
McDonald’s Corp. (NYSE:MCD) has an Earnings ESP of +0.22% and a Zacks Rank #3. The company is expected to report results on Jan 22, 2018. You can see the complete list of today’s Zacks #1 Rank stocks here.
Buffalo Wild Wings, Inc. (NASDAQ:BWLD) has an ESP of +7.16% and a Zacks Rank #3. The company is expected to announce results on Feb 6, 2018.
Shake Shack, Inc. (NYSE:SHAK) has an Earnings ESP of +28.95% and a Zacks Rank #3. The company is expected to report results on Mar 7, 2018.
Wall Street’s Next Amazon (NASDAQ:AMZN)
Zacks EVP Kevin Matras believes this familiar stock has only just begun its climb to become one of the greatest investments of all time. It’s a once-in-a-generation opportunity to invest in pure genius.
Home Depot’s (NYSE:HD) Q4 2024 report and guidance for 2025 have plenty to be unhappy about, but the simple truth is that this company turned a corner in 2024. It is on track for...
Nvidia is scheduled to release its Q4 earnings report at 4:20PM ET on Wednesday. A call with CEO Jensen Huang is set for 5:00PM ET. The chipmaker’s results will serve as a...
Warren Buffett has always critiqued airline stocks for being overly capital-intensive, exhibiting low growth, and relying heavily on cyclical consumer travel patterns—further...
Are you sure you want to block %USER_NAME%?
By doing so, you and %USER_NAME% will not be able to see any of each other's Investing.com's posts.
%USER_NAME% was successfully added to your Block List
Since you’ve just unblocked this person, you must wait 48 hours before renewing the block.
I feel that this comment is:
Thank You!
Your report has been sent to our moderators for review
Add a Comment
We encourage you to use comments to engage with other users, share your perspective and ask questions of authors and each other. However, in order to maintain the high level of discourse we’ve all come to value and expect, please keep the following criteria in mind:
Enrich the conversation, don’t trash it.
Stay focused and on track. Only post material that’s relevant to the topic being discussed.
Be respectful. Even negative opinions can be framed positively and diplomatically. Avoid profanity, slander or personal attacks directed at an author or another user. Racism, sexism and other forms of discrimination will not be tolerated.
Perpetrators of spam or abuse will be deleted from the site and prohibited from future registration at Investing.com’s discretion.