
- All Instrument Types
- Indices
- Equities
- ETFs
- Funds
- Commodities
- Currencies
- Crypto
- Bonds
- Certificates
Please try another search

CPI’s Positive Numbers

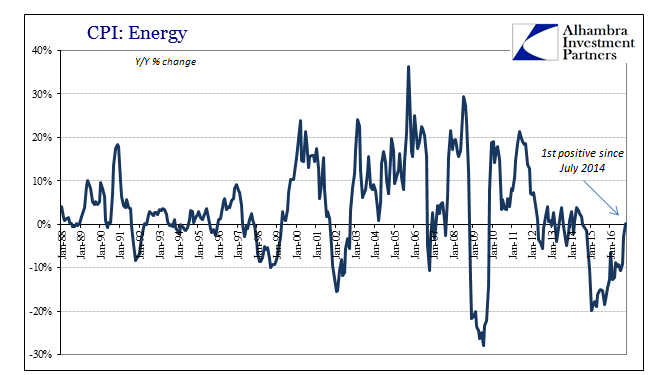
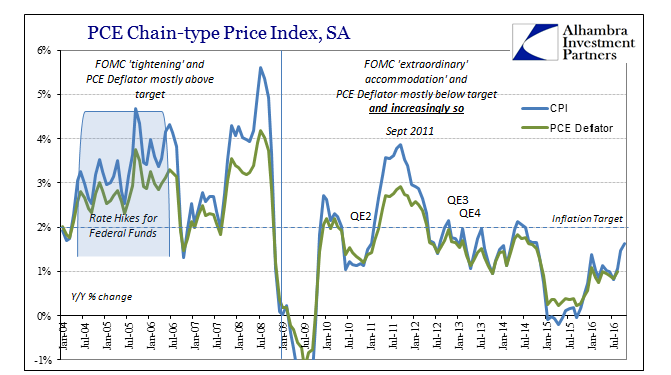
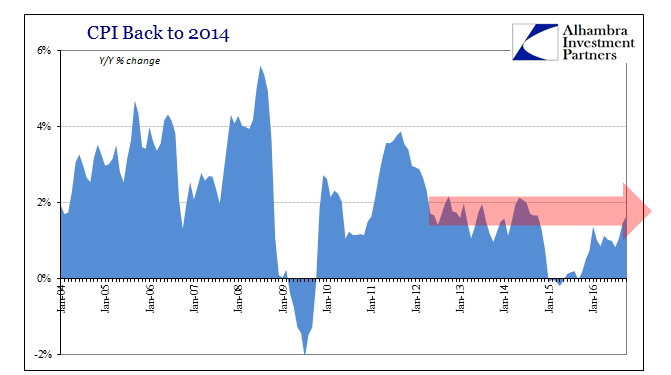
Consumer prices accelerated again in October 2016, with the overall CPI calculating a 1.64% inflation rate. That is up from 1.46% in September, and the highest since October 2014. The reason is energy prices. For the first time in over two years, the energy component of the CPI was positive year-over-year. Having been as low as -20% in early 2015, and almost -11% this July, the difference in energy is obvious on the overall index.
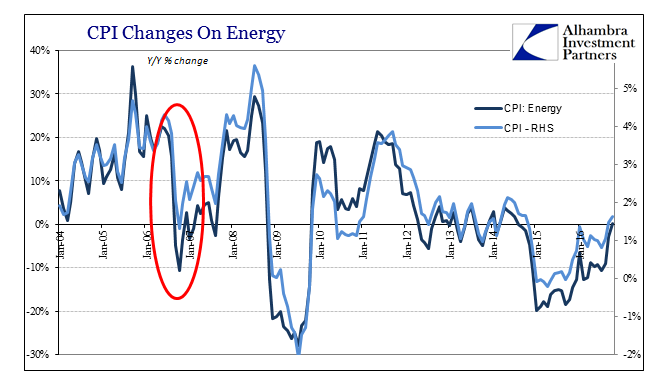
In fact, energy prices mainly determine the marginal changes in the total CPI. Though price differences are far more extreme in energy, their scaled effects on the whole index are very clear.
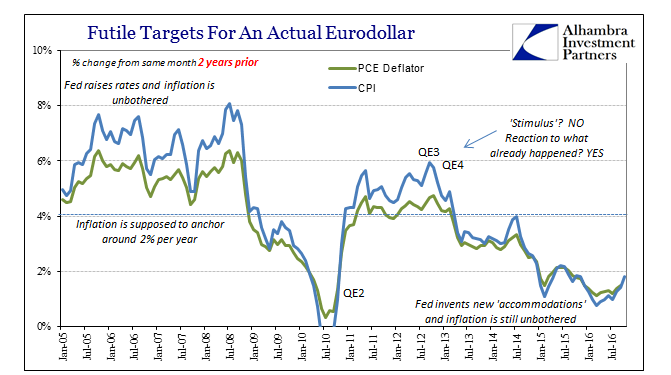
All that means is that consumer prices, according to the CPI, are back to where they were in 2012, 2013, and 2014. In other words, without the big drag from oil and other commodities, the CPI is still shallow. The 2-year change is just 1.81%, bringing into focus the highly unusual nature of this current period. In all prior periods, a sharp downturn was followed by an equally sharp upturn, prices as well as output. These are simple base effects and little more (and that “more” is where prices are doing more harm rather than reflect recovery).
Toward the end of 2006, for example, the energy component of the CPI fell sharply, down a little more than 10% that October, which had the effect of dragging the overall index down from near 4% to just 1.3%. Just two months later, despite energy prices still lagging, the CPI was back above 2.5% and then near 4% again by November 2007 once oil joined the final, mistaken eurodollar rush.
We see nothing like that over these past two years, and it is a visible deficiency. Though energy prices are no longer pulling the index down, they aren’t going to be pushing it up, either. Unless oil prices shoot massively higher from here, the CPI really hasn’t changed from 2014, though by every orthodox conception it should have; let alone all historical precedence. The CPI was practically unchanged in October 2015, meaning that the index has meandered upward on the base effects of oil, not the economic acceleration that would be accompanied by energy prices also going back to 2014 levels.
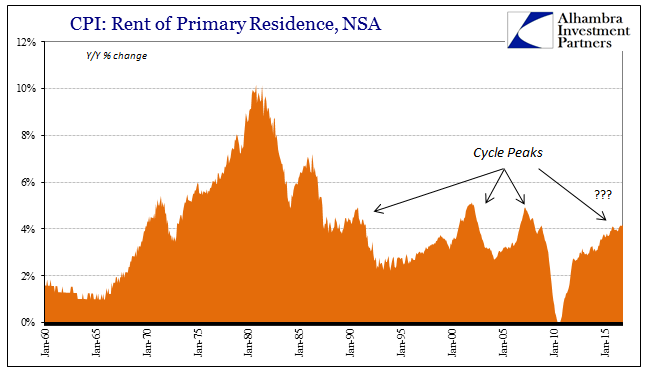
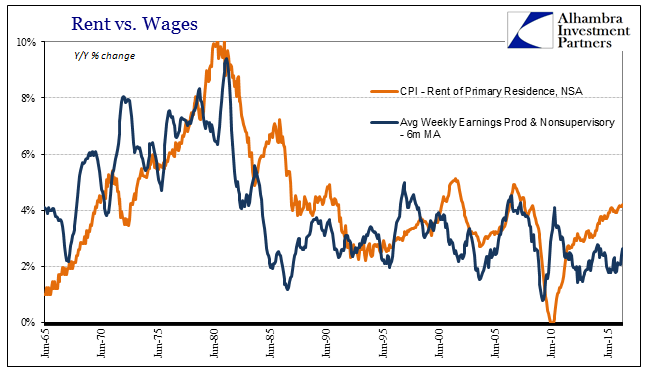
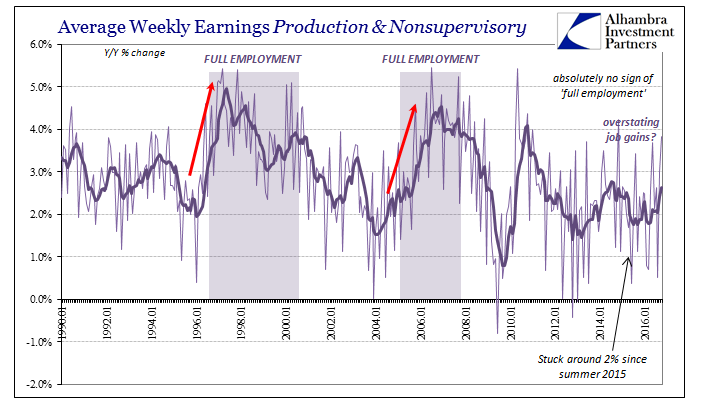
Part of the reason is likely the parts of the CPI where acceleration is having a more direct effect. The calculated change in the aggregate price of rents continues to be more than 4% per year. The possible increased cost of rent applies to a much larger segment of the US population as home ownership remains very low. It has left more Americans subject to non-discretionary housing costs rising much faster than wages (though calculated earnings were up sharply in October according to the separate BLS payroll stats).
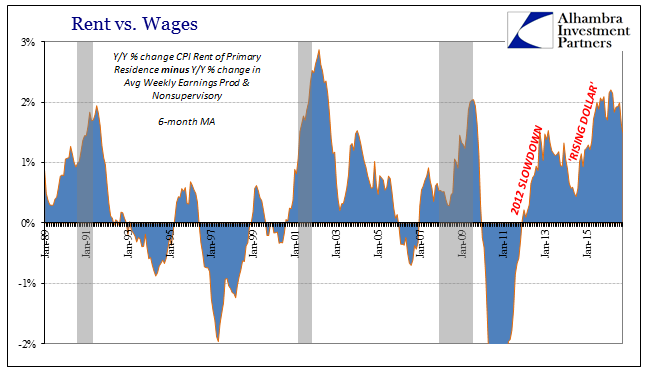
On average, weekly earnings are up 2.6% in the last six months where the CPI: Rent Index suggests a 4.2% increase in rents. That matches (July 2016) the highest inflation in this category since 2008.
That 1.6% difference between wages and rents may not sound like much, but it is consistent with past recessions and, again, this time applies to a much larger proportion of workers.
The CPI shows once more the difference between meaningful change and the same sorts of positive numbers that have populated the last five years. Like April, May, and June 2014, when the CPI also appeared to accelerate, nearly touching 2% that April, and then staying above 2% the next two months, the headline is being interpreted as something it isn’t. If the economy was truly accelerating, especially after the Fed swelling its balance sheet to $4.5 trillion, it would act as it had on all prior occasions. Instead, like wage growth that doesn’t come close to “full employment” of the past, there is “something” missing, the unmistakable liftoff that would be obvious by now. There is no wandering during economic periods transitioning from weak to actually strong.
What’s meaningful about the CPI is not that it got back to 1.64% again, rather it is that it took 18 months just to get back to 1.64%.
Related Articles

President Trump’s tariffs on Mexico and Canada have been postponed to March 1st after successful negotiations. US-China trade tensions continue to escalate with both countries...

Over the weekend, President Trump announced tariffs of 25% on both Canada and Mexico, as well as a 10% tariff on China. Such was not unexpected, as contained in the Trump tariff...

It seems surreal that Donald Trump has been in office for only two weeks. That’s because the amount of excitement he’s generated so far… is already more than most presidents...
Are you sure you want to block %USER_NAME%?
By doing so, you and %USER_NAME% will not be able to see any of each other's Investing.com's posts.
%USER_NAME% was successfully added to your Block List
Since you’ve just unblocked this person, you must wait 48 hours before renewing the block.
I feel that this comment is:
Thank You!
Your report has been sent to our moderators for review



Add a Comment
We encourage you to use comments to engage with other users, share your perspective and ask questions of authors and each other. However, in order to maintain the high level of discourse we’ve all come to value and expect, please keep the following criteria in mind:
Enrich the conversation, don’t trash it.
Stay focused and on track. Only post material that’s relevant to the topic being discussed.
Be respectful. Even negative opinions can be framed positively and diplomatically. Avoid profanity, slander or personal attacks directed at an author or another user. Racism, sexism and other forms of discrimination will not be tolerated.
Perpetrators of spam or abuse will be deleted from the site and prohibited from future registration at Investing.com’s discretion.