


Sign up to create alerts for Instruments,
Economic Events and content by followed authors
Free Sign Up Already have an account? Sign In
Please try another search

The Zacks Oil and Gas - Refining & Marketing industry consists of companies that are involved in selling refined petroleum products (including heating oil, gasoline, residual oil, etc.) and a plethora of non-energy materials (like asphalt, road salt, clay, and gypsum). Some of the companies also operate refined products terminals, storage facilities and transportation services. The primary activity of these firms involves buying crude/other feedstocks and processing them into a wide variety of refined products.
Let’s take a look at the industry’s three major themes:
Zacks Industry Rank Indicates Grim Outlook
The Zacks Oil and Gas - Refining & Marketing is a 13-stock group within the broader Zacks Oil - Energy sector. The industry currently carries a Zacks Industry Rank #202, which places it in the bottom 20% of more than 250 Zacks industries.
The group’s Zacks Industry Rank, which is basically the average of the Zacks Rank of all the member stocks, indicates dim near-term prospects. Our research shows that the top 50% of the Zacks-ranked industries outperforms the bottom 50% by a factor of more than 2 to 1.
The industry’s position in the bottom 50% of the Zacks-ranked industries is a result of negative earnings outlook for the constituent companies in aggregate. Looking at the aggregate earnings estimate revisions, it appears that analysts are pessimistic on this group’s earnings growth potential. As a proof of this, the industry’s earnings estimate for 2020 have decreased 33.5% in the past year. Meanwhile, the same for 2021 have slumped 32.7% over the trailing 12-month period.
Despite the bleak near-term prospects of the industry, we will present a few stocks that you may want to consider for your portfolio. But it’s worth taking a look at the industry’s shareholder returns and current valuation first.
Industry Lags Sector & S&P 500
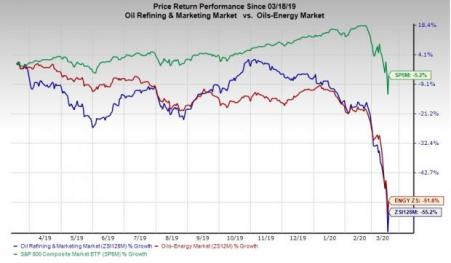
The Zacks Oil and Gas - Refining & Marketing industry has lagged the broader Zacks Oil - Energy Sector as well as the Zacks S&P 500 composite over the past year.
The industry has declined 55.2% over this period compared with the S&P 500’s loss of 5.2% and broader sector’s decrease of 51.6%.
One-Year Price Performance
Industry’s Current Valuation
Since oil and gas companies are debt laden, it makes sense to value them based on the EV/EBITDA (Enterprise Value/ Earnings before Interest Tax Depreciation and Amortization) ratio. This is because the valuation metric takes into account not just equity but also the level of debt. For capital-intensive companies, EV/EBITDA is a better valuation metric because it is not influenced by changing capital structures and ignores the effect of noncash expenses.
On the basis of the trailing 12-month enterprise value-to EBITDA (EV/EBITDA), the industry is currently trading at 5.06X, lower than the S&P 500’s 10.05X. However, it is well above the sector’s trailing-12-month EV/EBITDA of 3.63X.
Over the past five years, the industry has traded as high as 16.47X, as low as 4.34X, with a median of 7.39X.
Trailing 12-Month Enterprise Value-to EBITDA (EV/EBITDA) Ratio


Bottom Line
The traditional fuels refining operation — where crude is turned into products ranging from gasoline and diesel to jet fuel and asphalt — is heavily dependent on commodity price fluctuations. A tepid oil price environment generally results in the strengthening of crack spreads (or the difference between the price of oil and refined products).
Therefore, given the current weakness in oil (the input for refiners), demand is expected to be strong due to low product prices. This, in turn, will bolster cash flow generation at the companies with downstream exposure.
However, the health scare and the resulting economic uncertainty caused by the coronavirus have led to fears of lesser driving worldwide, translating into lower oil product demand. Consequently, the freed-up domestic barrels could find their way to the export market and weaken the fundamentals.
Despite the current downbeat mood in the industry, we are presenting four stocks with a Zacks Rank #3 (Hold) that investors may currently retain in their portfolio.
You can see the complete list of today’s Zacks #1 Rank (Strong Buy) stocks here.
Murphy USA Inc. (MUSA): This company is a leading independent retailer of motor fuel and convenience merchandise in the United States. Murphy USA has an expected earnings growth of 7.7% for this year.
Price and Consensus: MUSA
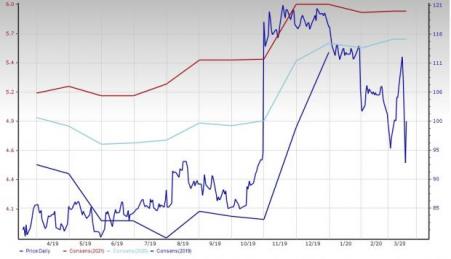
Phillips 66 (NYSE:PSX) (PSX): This diversified energy operator focuses on four main business segments - refining, marketing, chemicals and storage & transportation. Phillips 66 has an expected earnings growth of 7.3% for this year.
Price and Consensus: PSX
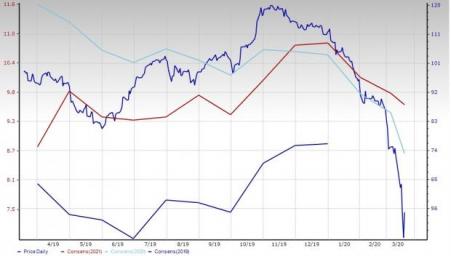
World Fuel Services Corporation (INT): World Fuel Services is engaged in marketing and selling marine, aviation, and land fuel products, plus associated services. The downstream operator has an expected earnings growth of 2.5% for this year.
Price and Consensus: INT
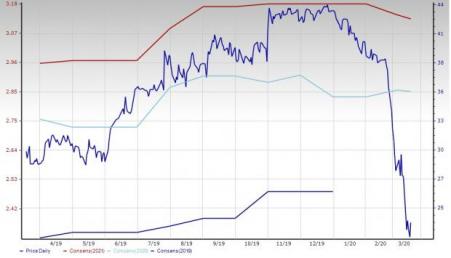
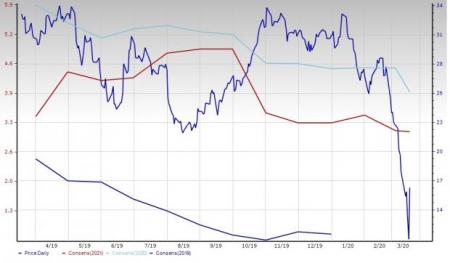
PBF Energy Inc. (PBF): PBF Energy provides end products that comprise heating oil, transportation fuels and lubricants among others. The company has an expected earnings growth of 338.9% for this year.
Price and Consensus: PBF
Using the Elliott Wave Principle (EWP), we have been successfully tracking the most likely path forward for the S&P 500 (SPX) over several months. Although there are many ways...
When looking for dividend stocks, high dividend yields are one important factor to consider. Even if a company’s dividend yield isn’t nearing double-digit percentages, finding...
Whenever Wall Street authoritative figures, such as a large institution or individual investor, decide to shift a view on a specific stock or industry, retail traders can...
Are you sure you want to block %USER_NAME%?
By doing so, you and %USER_NAME% will not be able to see any of each other's Investing.com's posts.
%USER_NAME% was successfully added to your Block List
Since you’ve just unblocked this person, you must wait 48 hours before renewing the block.
I feel that this comment is:
Thank You!
Your report has been sent to our moderators for review
Add a Comment
We encourage you to use comments to engage with other users, share your perspective and ask questions of authors and each other. However, in order to maintain the high level of discourse we’ve all come to value and expect, please keep the following criteria in mind:
Enrich the conversation, don’t trash it.
Stay focused and on track. Only post material that’s relevant to the topic being discussed.
Be respectful. Even negative opinions can be framed positively and diplomatically. Avoid profanity, slander or personal attacks directed at an author or another user. Racism, sexism and other forms of discrimination will not be tolerated.
Perpetrators of spam or abuse will be deleted from the site and prohibited from future registration at Investing.com’s discretion.