


Sign up to create alerts for Instruments,
Economic Events and content by followed authors
Free Sign Up Already have an account? Sign In
Please try another search

Cooper Companies Inc. (NYSE:COO) reported adjusted earnings of $2.65 in fourth-quarter fiscal 2017, surpassing the Zacks Consensus Estimate by a penny and improved 16% year over year. We believe that the upside was driven by robust revenue growth. The stock flaunts a Zacks Rank #1 (Strong Buy).
Revenues increased 8% on a year-over-year basis to $561.5 million. The figure also outpaced the Zacks Consensus Estimate of $558 million. The stellar top-line performance was driven by innovative products like Biofinity and daily silicone hydrogel lenses.
Segmental Analysis
The company has two business segments — CooperVision (CVI) and CooperSurgical (CSI).
Revenues at CooperVision Segment increased 7% at constant currency (cc) to $439 million on a year-over-year basis. The segment continues to gain from the company’s silicone hydrogel lenses led by solid prospects in the MyDay, Clariti and Biofinity platforms. Coming to the major catalysts within the CVI segment, robust performance by Toric (31% of CVI revenues), Multifocal (10.3%), single-use sphere lenses (27%) and non single-use sphere lenses (31.7%) propelled solid growth.
Multifocal revenues rose 4% at cc to $45.1 million, while Toric revenues increased 7% at cc to $136 million year over year. Single-use sphere lenses sales climbed 8% at cc to $118.9 million, while sales of non single-use sphere lenses were flat at $139 million year over year.
Geographically, CVI revenues inched up 2% in the Americas, while revenues from the Asia Pacific and EMEA rose 10% and 5% respectively, at cc.
Revenues at CooperSurgical Segment jumped 7% at cc to $122.5 million on a year-over-year basis. The fertility category (55% of CSI revenues) witnessed a 12% rise at cc in sales in the reported quarter, totaling $66.8 million. However, the office and surgical products category inched up 2% at cc to $55.7 million.
Cooper Companies, Inc. (The) Price, Consensus and EPS Surprise
Margin Details
As a percentage of revenues, adjusted gross margin at the CSI segment was 59.6% in the reported quarter, down 290 basis points (bps) year over year. The margins were offset by lower pricing from genetic testing within the Fertility segment and inventory adjustments on legacy products.
As a percentage of revenues, adjusted gross margin at the CVI segment was 67.7% in the reported quarter, higher than 64.8% of revenues in the year-ago quarter. Favorable currency and product mix boosted margins at the segment.
Hence, adjusted gross margin as a whole for Cooper Companies in the reported quarter was 65.9% of revenues, up 160 bps year over year.
Adjusted operating margin, as a percentage of revenues, was 27.2% of net revenues in the fiscal fourth quarter, up 210 bps on a year-over-year basis. Both CVI and CSI registered strong operating margin improvement in the quarter.
FY17 Results at a Glance
Cooper Companies reported revenues of $2,139 million in fiscal 2017, up 7% at cc on a year-over-year basis. CVI revenues were $1,674.1 million, up 7% at cc, and CSI revenues were $464.9 million, up 4% at cc.
Adjusted earnings for fiscal 2017 were $9.70, up 15% year over year.
Guidance
For fiscal 2018, total revenues are expected in the band of $2,480-$2,530 million.
Revenues at the CVI segment are estimated in the range of $1,830-$1,865 million, while CSI revenues are projected in the range of $650-$665 million. Meanwhile, adjusted earnings are anticipated in the band of $11.35-$11.65 per share. Cooper Companies expects fiscal 2018 gross margins to improve around 68%. Operating margins are expected to improve around 28% of net revenues.
Our Take
Cooper Companies ended fourth-quarter fiscal 2017 on a solid note, beating the Zacks Consensus Estimate on both lines. The company has always witnessed impressive results at CooperVision business segment. The CooperSurgical segment also delivered strong sales in the fourth quarter, buoyed by robust Toric performance. The company provided strong guidance for fiscal 2018. However, intense competition in the contact lens space will continue to increase pricing pressure for the company.
Notably, Cooper Companies has completed the acquisition of Paragon Vision Sciences earlier this month. This added a leading ortho-k technology to the company’s lens portfolio. According to the company, this buyout is likely to prove neutral to earnings per share in fiscal 2018, excluding one-time charges and deal-related amortization. Considering the outstanding performance of the stock, we expect Cooper Companies to scale higher in the coming quarters. In this regard, positive long-term growth of 10.8% holds promise.
Key Picks
Some other top-ranked stocks in the broader medical sector are PetMed Express, Inc. (NASDAQ:PETS) , Luminex Corporation (NASDAQ:LMNX) and Myriad Genetics, Inc. (NASDAQ:MYGN) . While PetMed and Myriad Genetics sport a Zacks Rank #1, Luminex carries a Zacks Rank #2 (Buy). You can see the complete list of today’s Zacks #1 Rank stocks here.
PetMed reported earnings of 43 cents per share in the second quarter of fiscal 2018, up 79.2% from the year-ago quarter’s 24 cents. Also, gross margin expanded 548 bps year over year to 35.2%.
Myriad Genetics reported adjusted earnings per share of 26 cents in the first quarter of fiscal 2018, up 13% year over year. Total revenues rose 7.2% year over year to $190.2 million in the first quarter.
Luminex reported adjusted earnings per share of 19 cents in the third quarter of 2017, up 216.7% year over year. Revenues increased almost 4.1% year over year to $74.1 million.
Today's Stocks from Zacks' Hottest Strategies
It's hard to believe, even for us at Zacks. But while the market gained +18.8% from 2016 - Q1 2017, our top stock-picking screens have returned +157.0%, +128.0%, +97.8%, +94.7%, and +90.2% respectively.
And this outperformance has not just been a recent phenomenon. Over the years it has been remarkably consistent. From 2000 - Q1 2017, the composite yearly average gain for these strategies has beaten the market more than 11X over. Maybe even more remarkable is the fact that we're willing to share their latest stocks with you without cost or obligation.
Regimes are changing in the market, and this could mean a few things, but today, it means that volatility is back. Whenever these shifts come, specifically to the S&P 500...
There are more than two reasons why NVIDIA’s (NASDAQ:NVDA) stock price can rally another 30% or more in 2025, but the two that underpin the others are data center and automotive...
Stocks fell sharply, with the S&P 500 leading the decline, finishing the day down almost 1.6% at 5,860. Meanwhile, the Nasdaq 100 dropped nearly 2.75%, closing at 20,550. This...
Are you sure you want to block %USER_NAME%?
By doing so, you and %USER_NAME% will not be able to see any of each other's Investing.com's posts.
%USER_NAME% was successfully added to your Block List
Since you’ve just unblocked this person, you must wait 48 hours before renewing the block.
I feel that this comment is:
Thank You!
Your report has been sent to our moderators for review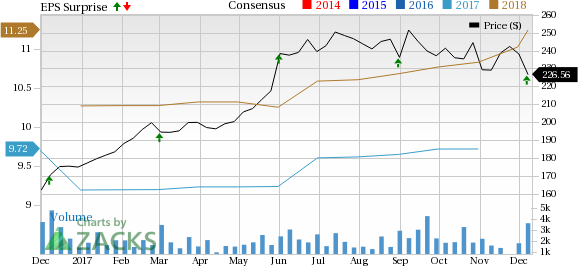

Add a Comment
We encourage you to use comments to engage with other users, share your perspective and ask questions of authors and each other. However, in order to maintain the high level of discourse we’ve all come to value and expect, please keep the following criteria in mind:
Enrich the conversation, don’t trash it.
Stay focused and on track. Only post material that’s relevant to the topic being discussed.
Be respectful. Even negative opinions can be framed positively and diplomatically. Avoid profanity, slander or personal attacks directed at an author or another user. Racism, sexism and other forms of discrimination will not be tolerated.
Perpetrators of spam or abuse will be deleted from the site and prohibited from future registration at Investing.com’s discretion.