


Sign up to create alerts for Instruments,
Economic Events and content by followed authors
Free Sign Up Already have an account? Sign In
Please try another search

The insurance industry seems well placed at present. Favorable factors like benign catastrophe environment, improving rate environment and economic progression boost insurers for growth.
Underwriting results, the major indicator of profitability for any insurer, are expected to improve on the back of a benign catastrophe environment. Due to a string of cat events such as the unprecedented hurricane activity and the California wildfires, the year 2017 emerged costliest in terms of catastrophe loss, weighing on the underwriting profitability.
As a result of devastating nature’s fury, insurers braved price hikes that had remained flat for quite a while.
Within the insurance space, the property and casualty insurers are among the major beneficiaries of an improving rate environment. The Fed had promised to make three interest rate raises in 2018 and 2019, reflects the regulatory body’s confidence in the bettering U.S. economy. Last year, the Fed had implemented three rate hikes with the metric being now pegged at 1.5%.
An increased rate is expected to positively impact the net investment income, a major component of an insurer’s top line. A broader invested asset base and alternative asset classes are other upsides.
Also, President Donald Trump’s tax reform policy, an overhaul of tax code after 31 years, lowers the corporate tax burden. Notably, the tax rate lowered to 20% from 35% will likely act add an impetus to the industry players.
Though the Property and Casualty Insurance industry is ranked at #138 (lies at the bottom half of the Zacks Industry Rank for 252 plus industries), it has outperformed the S&P 500 index’s gain of 2.4% year to date, registering a 2.8% rise.


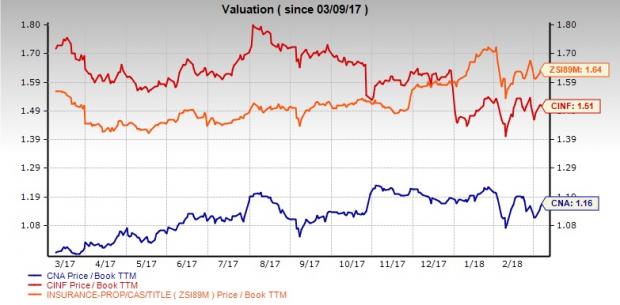
Valuation
The price to book value metric is the best multiple used for valuing insurers. Compared with the Property and Casualty Industry’s P/B ratio of 1.64, Cincinnati Financial is underpriced with a reading of 1.51. Meanwhile, CNA Financial is much cheaper with a trailing 12-month P/B multiple of 1.16. This round again goes to CNA Financial as its shares are cheaper than Cincinnati Financial’s.
Debt-to-Equity
Both companies have lower debt-to-equity as compared to the industry average of 32.29%. Cincinnati Financial with a leverage ratio of 10.32 has a visible edge over CNA Financial with the same of 23.34.

Return on Equity
Both CNA Financial and Cincinnati Financial’s respective return on equity of 7.64% and 5.99% exceeded the industry average of 5.4%. With a higher mark, CNA Financial one more wins this round.

Dividend Yield
Cincinnati Financial’s dividend yield was 2.64% in a year whereas CNA Financial’s was 2.29%. Both have a dividend yield that outshines the industry’s average of 0.47%. Comparatively, Cincinnati Financial stays ahead of CNA Financial.
Notably, Cincinnati Financial has been increasing the yearly dividend for the past 58 years, a record matched by only eight other publicly-traded companies in the United States.

Combined Ratio
Combined ratio, the percentage of premiums paid out as claims and expenses, determines the underwriting profitability of an insurer.
CNA Financial’s combined ratio was 97.1 in 2017 while Cincinnati Financial’s is 97.5. CNA Financial wins this round too.
Earnings Surprise History
As far as the companies’ surprise history goes, both CNA Financial and Cincinnati Financial have surpassed the Zacks Consensus Estimate in the last four quarters with an average beat of 46.88% and 16.49%, respectively. CNA Financial has yet again got the better of Cincinnati Financial.
Earnings Estimate Revisions and Growth Projections
CNA Financial’s 2018 estimates have moved 7.2% north and 20.6% up for 2019 in the last 30 days. While the Zacks Consensus Estimate for Cincinnati Financial’s current-year earnings have been revised 2.4% downward but increased 5.5% for 2019 over the same time frame.
For CNA Financial, the consensus mark for 2018 earnings per share is estimated to grow 19.5% on 1.4% revenue improvement. For 2019, the company’s bottom line is expected to inch up 1.6% on 2.8% top-line rise. CNA Financial has a long-term expected earnings per share growth rate of 5%.
The Cincinnati Financial stock has seen the Zacks Consensus Estimate for earnings per share in 2018 being projected at a 20.4% rally on 4.1% revenue increase. For 2019, the bottom line is predicted to climb 5.3% on 4.2% revenue improvement.
Here too, CNA Financial gains advantage over Cincinnati Financial.
To Conclude
CNA Financial is positioned higher than Cincinnati Financial on the basis of price performance, valuation, return on equity, combined ratio, earnings surprise history and growth projections. Considering parameters like dividend yield and leverage ratio, Cincinnati Financial seems better off than CNA Financial. Per our comparative analysis, CNA Financial is thus a more attractive investment option than Cincinnati Financial.
The Hottest Tech Mega-Trend of All
Last year, it generated $8 billion in global revenues. By 2020, it's predicted to blast through the roof to $47 billion. Famed investor Mark Cuban says it will produce "the world's first trillionaires," but that should still leave plenty of money for regular investors who make the right trades early.
See Zacks' 3 Best Stocks to Play This Trend >>
In a market fraught with uncertainty, investors often seek refuge in defensive-minded stocks that offer stability and resilience. Two such stalwarts, Johnson & Johnson and...
Bitcoin has gained legitimacy as it has achieved mainstream status these days. Even the United States Securities and Exchange Commission (SEC) has acknowledged its legitimacy with...
Stocks fell sharply, with the S&P 500 leading the decline, finishing the day down almost 1.6% at 5,860. Meanwhile, the Nasdaq 100 dropped nearly 2.75%, closing at 20,550. This...
Are you sure you want to block %USER_NAME%?
By doing so, you and %USER_NAME% will not be able to see any of each other's Investing.com's posts.
%USER_NAME% was successfully added to your Block List
Since you’ve just unblocked this person, you must wait 48 hours before renewing the block.
I feel that this comment is:
Thank You!
Your report has been sent to our moderators for review
Add a Comment
We encourage you to use comments to engage with other users, share your perspective and ask questions of authors and each other. However, in order to maintain the high level of discourse we’ve all come to value and expect, please keep the following criteria in mind:
Enrich the conversation, don’t trash it.
Stay focused and on track. Only post material that’s relevant to the topic being discussed.
Be respectful. Even negative opinions can be framed positively and diplomatically. Avoid profanity, slander or personal attacks directed at an author or another user. Racism, sexism and other forms of discrimination will not be tolerated.
Perpetrators of spam or abuse will be deleted from the site and prohibited from future registration at Investing.com’s discretion.