


Sign up to create alerts for Instruments,
Economic Events and content by followed authors
Free Sign Up Already have an account? Sign In
Please try another search

Cheniere Energy, Inc. (NYSE:LNG) reported mixed third-quarter 2017 results wherein the company incurred wider-than-expected loss, while revenues topped the Zacks Consensus Estimate.
Cheniere Energy posted net loss of $1.09 per share in the third quarter, much wider than the Zacks Consensus Estimate of a loss of 16 cents. The weaker-than-expected results stemmed from increased costs incurred in the quarter. Further, the loss per share also widened from the prior-year quarter loss of 41 cents.
However, the U.S.-gas exporter’s quarterly revenues jumped to $1,403 million from $465 million recorded in the year-ago quarter, reflecting massive jump of 202%. The top line surge led the company’s adjusted EBITDA to jump to $442 million against $67 million in third-quarter 2016. Further, the revenue also surpassed the Zacks Consensus Estimate of $1,259 million.
Cheniere Energy, Inc. Price, Consensus and EPS Surprise
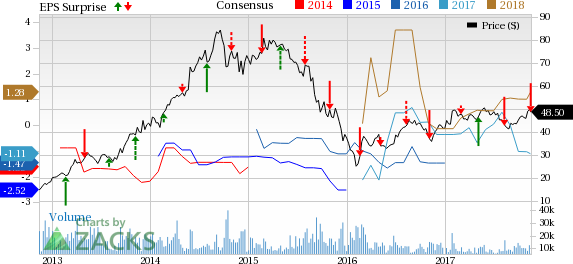
Cheniere Energy, Inc. Price, Consensus and EPS Surprise | Cheniere Energy, Inc. Quote
During the quarter, the company shipped 44 cargoes from Sabine Pass liquefied natural gas terminal in Louisiana. Total volumes lifted in the reported quarter were 160 trillion British thermal units.
Costs & Expenses
Overall costs and expenses soared 145.8% to $1,106 million from the same quarter last year. The increase is mainly attributed to the higher cost of sales which jumped to $824 million compared with $253 million in the prior-year quarter. Operating and maintenance expenses rose to $114 million in the quarter, reflecting an increase of 87% from the prior-year figure. Depreciation and amortization expenses also increased from $49 million a year ago to $92 million in the reported quarter. Higher SG&A costs and inclusion of impairment charges also led to increased costs in the quarter under review. Increase in these costs was partly offset by the absence of restructuring expenses incurred in the year-ago quarter.
Balance Sheet
As of Sep 30, 2017, Cheniere Energy had approximately $919 million in cash and cash equivalents and $24,923 million in net long-term debt. The company’s debt to capital ratio is 95.8%.
Guidance
Cheniere Energy updated its guidance for full-year 2017 despite the wider-than-expected loss. The raised guidance reflects the management’s confidence in its construction projects which are much ahead of the schedule. The adjusted EBITDA is expected to be between $1.8 billion and $1.9 billion, 8.8% higher than the prior guidance. Distributable cash flow is likely to be between $600 million and $700 million compared with the prior guidance level of $500-$700 million.
The company also initiated a preliminary guidance for full-year 2018. The adjusted EBITDA is expected to be between $1.9 billion and $2.1 billion. The guidance reflects the management’s optimism about strong LNG production at Sabine Pass along with expected improvement in the LNG prices in 2018.
Project Updates
Sabine Pass Liquefaction Project (SPL): Altogether, Cheniere Energy intends to construct up to six trains at Sabine Pass with each train expected to have a capacity of about 4.5 million tons per annum. In October, the company announced the completion of the fourth liquefaction train, which is set for first commercial delivery in March 2018 under a 20-year sale and purchase contract with GAIL (India) Limited. With the completion of Train 4, total capacity at the export terminal has risen from 13.5 million tons per annum (Mtpa) to 18 Mtpa. Train 5 is under construction and is expected to begin exporting in the second half of 2019. Train 6 is being commercialized and has secured the necessary regulatory approvals.
Corpus Christi Liquefaction Project (CCL): Cheniere Energy’s Corpus Christi LNG project, under which the company intends to develop three trains, is also expected to come online in 2019. Trains 1 and 2 are under construction, while Train 3 is being commercialized and has the necessary approvals in place.
Corpus Christi Expansion Project: Cheniere Energy intends to develop seven midscale liquefaction trains adjacent to the CCL Project. The company has initiated the regulatory approval process regarding same. The total production capacities for these trains are expected to be approximately 9.5 Mtpa.
Zacks Rank & Key Picks
Cheniere Energy currently carries a Zacks Rank #3 (Hold). You can see the complete list of today’s Zacks #1 Rank (Strong Buy) stocks here.
Some better-ranked players in the same industry are Denbury Resources, Inc. (NYSE:DNR) , Northern Oil and Gas, Inc. (NYSE:NOG) and Rice Midstream Partners LP (NYSE:RMP) . All three firms sport a Zacks Rank #1.
Denbury Resources delivered an average positive earnings surprise of 125% in the trailing four quarters.
Northern Oil and Gas reported an average positive earnings surprise of 175% in the trailing four quarters.
Rice Midstream posted average positive earnings surprise of 35.25% in the trailing four quarters.
The Hottest Tech Mega-Trend of All
Last year, it generated $8 billion in global revenues. By 2020, it's predicted to blast through the roof to $47 billion. Famed investor Mark Cuban says it will produce "the world's first trillionaires," but that should still leave plenty of money for regular investors who make the right trades early.
See Zacks' 3 Best Stocks to Play This Trend >>
US stocks look expensive by historical standards. As of late January 2025, the S&P 500’s trailing 12-month P/E ratio was at 30.5—well above its 10-year average of 23. This...
Defense stocks took a tumble heading into 2025 as President Trump returned to the White House for his second term. Trump has stated his intent as a peacemaker to bring the wars in...
Using the Elliott Wave Principle (EWP), we have been tracking the most likely path forward for the Nasdaq 100 (NDX). Although there are many ways to navigate the markets and to...
Are you sure you want to block %USER_NAME%?
By doing so, you and %USER_NAME% will not be able to see any of each other's Investing.com's posts.
%USER_NAME% was successfully added to your Block List
Since you’ve just unblocked this person, you must wait 48 hours before renewing the block.
I feel that this comment is:
Thank You!
Your report has been sent to our moderators for review
Add a Comment
We encourage you to use comments to engage with other users, share your perspective and ask questions of authors and each other. However, in order to maintain the high level of discourse we’ve all come to value and expect, please keep the following criteria in mind:
Enrich the conversation, don’t trash it.
Stay focused and on track. Only post material that’s relevant to the topic being discussed.
Be respectful. Even negative opinions can be framed positively and diplomatically. Avoid profanity, slander or personal attacks directed at an author or another user. Racism, sexism and other forms of discrimination will not be tolerated.
Perpetrators of spam or abuse will be deleted from the site and prohibited from future registration at Investing.com’s discretion.