


Sign up to create alerts for Instruments,
Economic Events and content by followed authors
Free Sign Up Already have an account? Sign In
Please try another search

Integrated energy companies like Royal Dutch Shell (LON:RDSa) plc RDS.A have seen their stock rise since September due to surge in oil prices. The sustained rally in the underlying commodity has given a major boost to the upstream units of these firms as they are in a far better position to extract more value from their products.
What's more, unlike other short-lived rallies over the past three years, we believe the current higher oil prices are a result of improving fundamentals. Solid demand growth, declining inventories and the extension of OPEC-led supply cuts until the end of 2018 is helping to balance the market and support the strong uptrend. In fact, WTI hit a more than two-year high of around $59 recently.
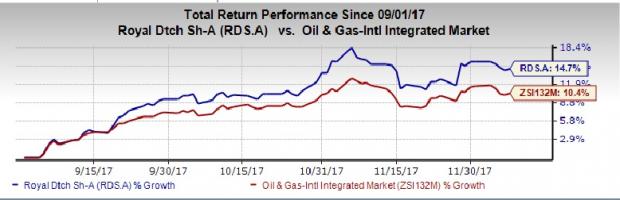
Stock Performance Since September
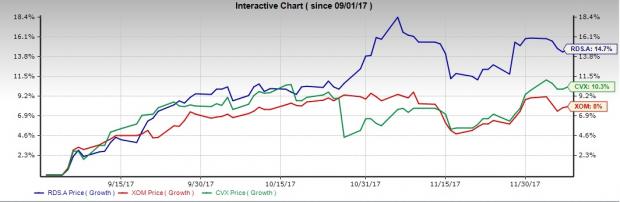
All of this has contributed to a nice run for Shell with its stock price jumping approximately 14.7% since September, outperforming the industry's 10.4% growth. Shell's peers like ExxonMobil Corp. (NYSE:XOM) and Chevron Corp. (NYSE:CVX) rose by 8% and 10.3%, respectively, during the same period.
Shell’s Cash Flow, Cost and Dividend Position
Hit by the industry downturn and weak financials owing to the $50-billion acquisition of BG Group, Shell began to pay dividend in the form of shares in 2015 to address cash flow woes. However, the supermajor is finally aborting the two-and-a-half-year long scrip dividend program as cost-containment efforts and divestment strategies have paid off. The company’s solid third-quarter results also underscore the fact that it has successfully adapted itself to thrive at $50-barrel crude.
On Management Day, which was observed last month, CEO of Shell — Ben van Beurden — announced the resumption of cash dividends from the fourth quarter of 2017. Beurden also announced plans to buy back shares of at least $25 billion by the end of 2020. With the buyback, Shell will be able to overcome the dilution problem under its scrip dividend plan that entitles investors to choose stocks as payout instead of cash.
Driven by synergies from its $50-billion BG Group acquisition last year and improving energy landscape, Shell has also raised its guidance for free cash flow, which has remained consistently strong over the last five quarters. The company now expects to generate $25-$30 billion by 2020 at Brent crude price of $60 a barrel.
With already closing $23 billion worth sales, the company is on track to achieve its $30 billion divestment target by 2018. Further, it announced asset disposals worth $2 billion and additional $5 billion divestment deals in advanced talks over and above the $23 billion completed.
Reaffirming its priorities to slash costs and cut debts, Shell, which ended the third quarter with debt to capital ratio of 25.4%, now aims to reduce the leverage to 20% on the back of operational efficiency and divestment spree.
Can the Stock Continue to March Higher?
While we conclude that Shell’s dividends are safe (despite the high yield of more than 5%) and the company is on track to deliver on its plan to produce free cash flow to support the payout, share price appreciation will be limited in the near-to-medium term. The future path of The Hague-based supermajor will depend on whether it can generate enough free cash flow through the cycle to plough back into growth initiatives after maintaining its dividend.
Moreover, Royal Dutch Shell saw its third-quarter oil and gas production decline sequentially as well as from the year-ago period. The group's disposal program – though successful in reducing the company’s cost and enhancing cash flows – could further affect volume growth.
Finally, Shell still has some ground to cover in bringing down its debt. As of Sept. 30, 2017, the company had $20,699 million in cash and $88,356 million in debt (including short-term debt). Net debt-to-capitalization ratio was approximately 25.4%, down from 29.2% a year ago following the BG Group acquisition but well above Shell’s desired 20%.
Zacks Rank & Stock Picks
Shell currently carries a Zacks Rank #3 (Hold), implying that it is expected to perform in line with the broader U.S. equity market over the next one to three months.
Meanwhile, one can look at a better-ranked integrated energy player like BP plc (NYSE:BP) that sports a Zacks Rank #1 (Strong Buy). You can see the complete list of today’s Zacks #1 Rank (Strong Buy) stocks here.
London-based BP is one of the largest publicly traded oil and gas companies in the world. It is engaged in oil and gas exploration and production, refining and marketing of petroleum products, and other energy-related businesses. BP surpassed estimates in three of the last four quarters at an average rate of 26.8%.
Today's Stocks from Zacks' Hottest Strategies
It's hard to believe, even for us at Zacks. But while the market gained +18.8% from 2016 - Q1 2017, our top stock-picking screens have returned +157.0%, +128.0%, +97.8%, +94.7% and +90.2%, respectively.
And this outperformance has not just been a recent phenomenon. Over the years it has been remarkably consistent. From 2000 - Q1 2017, the composite yearly average gain for these strategies has beaten the market more than 11X over. Maybe even more remarkable is the fact that we're willing to share their latest stocks with you without cost or obligation.
Since the Robotaxi event on October 11th, Tesla (NASDAQ:TSLA) stock is up 38%, currently priced at $291.60 per share This is a return to the early November 2024 price level. But...
The Q4 2024 earnings season tapers off from here, with S&P 500® EPS growth surpassing 17%, the highest in 3 years Large cap outlier earnings dates this week include:...
Shares of Alibaba (NYSE:BABA) are on a tear to start off 2025. The consumer discretionary and tech stock is up by 52% this year as of the Feb. 25 close. The company’s cloud...
Are you sure you want to block %USER_NAME%?
By doing so, you and %USER_NAME% will not be able to see any of each other's Investing.com's posts.
%USER_NAME% was successfully added to your Block List
Since you’ve just unblocked this person, you must wait 48 hours before renewing the block.
I feel that this comment is:
Thank You!
Your report has been sent to our moderators for review
Add a Comment
We encourage you to use comments to engage with other users, share your perspective and ask questions of authors and each other. However, in order to maintain the high level of discourse we’ve all come to value and expect, please keep the following criteria in mind:
Enrich the conversation, don’t trash it.
Stay focused and on track. Only post material that’s relevant to the topic being discussed.
Be respectful. Even negative opinions can be framed positively and diplomatically. Avoid profanity, slander or personal attacks directed at an author or another user. Racism, sexism and other forms of discrimination will not be tolerated.
Perpetrators of spam or abuse will be deleted from the site and prohibited from future registration at Investing.com’s discretion.