- All Instrument Types
- Indices
- Equities
- ETFs
- Funds
- Commodities
- Currencies
- Crypto
- Bonds
- Certificates
Please try another search

CAD/JPY: Trading Potential False Breakout

Talking Points- Daily Trend Line Break in CAD/JPY
- Key Resistance Zone for Initiating New Shorts
- The Ideal Time Frame for Taking This Trade
As markets continue to prove choppy, and on the heels of yesterday's surprising stop-out in CAD/CHF, this particular trading approach appears to have entered a lower-probability environment. Traders are often spooked by this, as it is possible to have several stop-outs in a row. The ability to move on depends upon having both back-tested and forward-tested the applicable strategy. Regular readers will recall the period in December that was similarly tricky, but also know that January easily yielded a spate of winning trades that more than erased all of December’s drawdowns.
In total, one very important lesson in itself is this: The best response to such trying market conditions is to continue to take trades, albeit cautiously and in strict accordance with one's own proven trading plan.
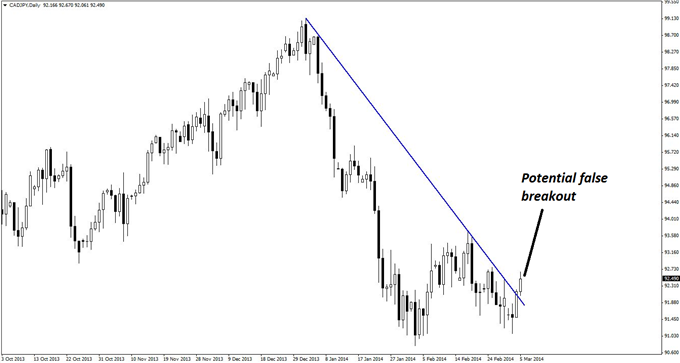
Now, as seen below, CADJPY has just broken a declining line of resistance on the daily chart. As always, the first suspicion is that this could be a false breakout, or that it will at least retest the top side of the previous resistance-turned-support. Either way, a move back down in the near future can be anticipated.
Daily Trend Line Break in CAD/JPY
CAD/JPY: Daily" title="CAD/JPY: Daily" align="bottom" border="0" height="242" width="474">
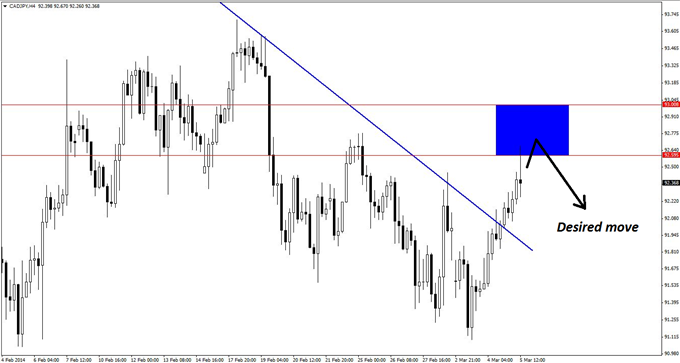
On the four-hour chart below, previous horizontal support and resistance suggest a resistance zone of 92.59-93.00. This represents a risk of 41 pips, and possibly less when taking qualifying short positions on an hourly chart.
Key Resistance Zone for Selling CAD/JPY
CAD/JPY: 4 Hour" title="CAD/JPY: 4 Hour" align="bottom" border="0" height="242" width="474">
Just from a visual examination of the charts, we see potential for 130 or more pips to the downside, which makes for compelling risk profile. Moreover, the fact that this trade is in line with the daily trend is all the more encouraging.
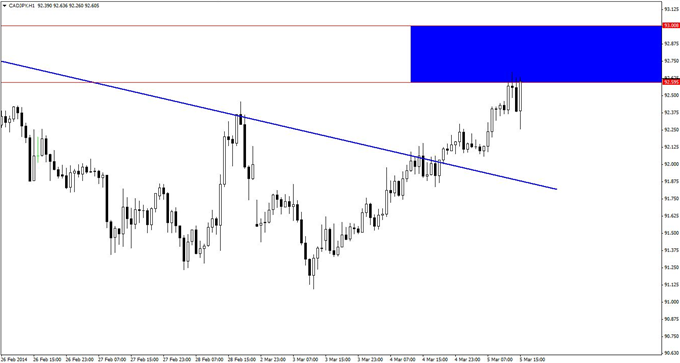
The hourly chart below has just begun to flirt with the key resistance zone, and fortunately, a false signal in the past two hours may have been avoided. At this point, the ideal scenario would be for price to make a higher high, and then to provide a reversal trigger, such as a pin bar, bearish engulfing pattern, or bearish reversal divergence on the hourly chart.
Viable Sell Signals on CAD/JPY Hourly Chart
CAD/JPY: 1-Hour" title="CAD/JPY: 1-Hour" align="bottom" border="0" height="242" width="474">
Two or three attempts can be made to get in on this trade. Overall, however, traders should remain extremely cautious and willing to scalp parts of positions out at the first sign of trouble in order to protect valuable profits. Considering the current state of the markets, defense is the name of the game.
By Kaye Lee, private fund trader and head trader consultant, StraightTalkTrading.com
Related Articles

As investors attempt to keep up with the daily shift in President Trump’s tariff policies, the February CPI report out of the United States on Wednesday will likely come as a...
Japanese yen extends rally for a third consecutive day BoJ’s Uchida says rate hikes still on the table despite tariff concerns US nonfarm payrolls expected to edge slightly The...

EUR/USD is trading near 1.0806 on Friday, maintaining its position despite failing to extend its gains further. Investors’ focus is on February’s upcoming US employment data,...
Are you sure you want to block %USER_NAME%?
By doing so, you and %USER_NAME% will not be able to see any of each other's Investing.com's posts.
%USER_NAME% was successfully added to your Block List
Since you’ve just unblocked this person, you must wait 48 hours before renewing the block.
I feel that this comment is:
Thank You!
Your report has been sent to our moderators for review


Add a Comment
We encourage you to use comments to engage with other users, share your perspective and ask questions of authors and each other. However, in order to maintain the high level of discourse we’ve all come to value and expect, please keep the following criteria in mind:
Enrich the conversation, don’t trash it.
Stay focused and on track. Only post material that’s relevant to the topic being discussed.
Be respectful. Even negative opinions can be framed positively and diplomatically. Avoid profanity, slander or personal attacks directed at an author or another user. Racism, sexism and other forms of discrimination will not be tolerated.
Perpetrators of spam or abuse will be deleted from the site and prohibited from future registration at Investing.com’s discretion.