


Sign up to create alerts for Instruments,
Economic Events and content by followed authors
Free Sign Up Already have an account? Sign In
Please try another search

Brown-Forman Corporation BF.B has reported third-quarter fiscal 2020 results, wherein earnings and sales missed estimates. However, the bottom line improved on a year-over-year basis, while the top line remained flat. Further, the company revised its view for fiscal 2020, citing disruptions in international markets due to the coronavirus outbreak and an uncertain global economic environment.
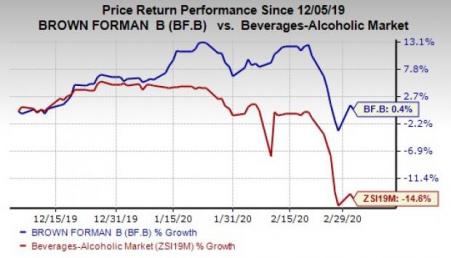
Shares of Brown-Forman declined 3% in the pre-market trading driven by the soft results and guidance. Overall, the Zacks Rank #3 (Hold) company’s shares have gained 0.4% in the past three months against the industry’s decline of 14.6%.
Brown-Forman Corporation Price, Consensus and EPS Surprise
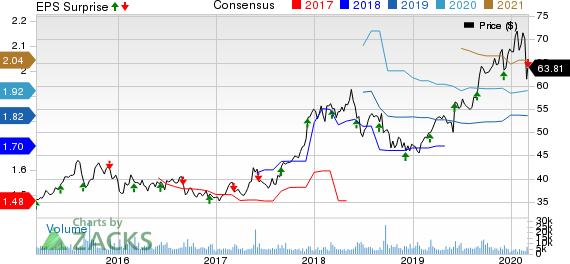
Brown-Forman Corporation price-consensus-eps-surprise-chart | Brown-Forman Corporation Quote
For the first nine months of fiscal 2020, underlying sales improved 3%, in line with growth witnessed in the first half. On a geographic basis, underlying sales growth was the strongest in the United States and emerging markets, each growing 6%. Growth in the United States was driven by continued double-digit gains from its premium bourbons, Woodford Reserve and Old Forester, and the launch of Jack Daniel’s Tennessee Apple (NASDAQ:AAPL). Additionally, it witnessed double-digit underlying net sales gains in aggregate from tequilas, Herradura and el Jimador, in the United States. Meanwhile, underlying net sales grew 2% in developed international markets.
Growth across the company’s brand portfolio was led by Woodford Reserve, which reported 19% underlying sales growth in the first nine months of fiscal 2020. Notably, underlying sales for its premium bourbon brands, including Woodford Reserve and Old Forester, grew 22%.
Meanwhile, its tequila brands reported 10% rise in underlying sales growth globally, including a 20% increase for Herradura and 11% for el Jimador. Further, underlying net sales for the Jack Daniel’s family of brands improved 3% globally, driven by the launch of Jack Daniel’s Tennessee Apple in the United States, Jack Daniel’s RTDs in Germany and the United States, and broad-based growth of Jack Daniel’s Tennessee Honey.
However, underlying sales for the company’s non-branded business, comprising used barrels, bulk whiskey and contract bottling, declined 27% on lower volumes and prices for used barrels and a reduction in bulk whiskey sales.
Margins & Costs
In the fiscal third quarter, Brown-Forman’s gross profit declined nearly 2% to $557 million, while gross margin contracted 120 basis points (bps) to 61.9%. On an underlying basis, gross profit increased 3%.
Selling, general and administrative (SG&A) expenses rose 2% year over year to $153 million, both on a reported and underlying basis. Advertising expenses of $104 million remained flat both on a reported and underlying basis.
Operating income declined 5% to $304 million on a reported basis but increased 5% on an underlying basis. Meanwhile, operating margin contracted 150 bps to 33.8%.
Balance Sheet & Cash Flow
Brown-Forman ended third-quarter fiscal 2020 with cash and cash equivalents of $276 million, and long-term debt of $2,293 million. Its total shareholders’ equity was $2,005 million as of Jan 31, 2020. In the first nine months of fiscal 2020, it generated $509 million in cash from operating activities.
On Jan 28, the company declared a quarterly cash dividend of 17.43 cents per share on Class A and Class B shares, reflecting an annualized dividend rate of 69.72 cents. The dividend is payable Apr 1, 2020, to shareholders of record as of Mar 9.
Fiscal 2020 Outlook
Brown-Forman revised its outlook for fiscal 2020, driven by lowered expectations in some of its international markets, owing to short-term disruptions, and an increasingly uncertain global economic and geopolitical backdrop. The revised view also includes impacts from the COVID-19 global epidemic.
For fiscal 2020, the company now expects low-single-digit underlying sales growth. It expects underlying operating margin to be flat to decline modestly. Further, earnings per share are envisioned to be $1.75-$1.80. Earlier, the company had projected earnings per share of $1.75-$1.85, with underlying sales growth of 5-7%.
Looking for Better-Ranked Beverage Stocks? Check These
The Coca-Cola Company (NYSE:KO) has a long-term earnings growth rate of 7.2%. It currently carries a Zacks Rank #2 (Buy). You can see the complete list of today’s Zacks #1 Rank (Strong Buy) stocks here.
Monster Beverage Corporation (NASDAQ:MNST) , also a Zacks Rank #2 stock, has delivered a positive earnings surprise of 2.6%, on average, over the last four quarters.
Coca Cola Femsa S.A.B. de C.V. (NYSE:KO) currently has a long-term earnings growth rate of 12.4% and a Zacks Rank #2.
Today's Best Stocks from Zacks
Would you like to see the updated picks from our best market-beating strategies? From 2017 through 2019, while the S&P 500 gained and impressive +53.6%, five of our strategies returned +65.8%, +97.1%, +118.0%, +175.7% and even +186.7%.
This outperformance has not just been a recent phenomenon. From 2000 – 2019, while the S&P averaged +6.0% per year, our top strategies averaged up to +54.7% per year.
See their latest picks free >>
• Trump’s trade war, inflation data, and last batch of earnings will be in focus this week. • DoorDash’s imminent inclusion in the S&P 500 is likely to trigger a wave of...
The big US stocks dominating markets and investors’ portfolios just finished another earnings season. They reported spectacular collective results including record sales, profits,...
“Quality” stocks with strong fundamentals tend to be rewarding places to stash hard-earned money. Since 2009, investing in a basket of quality stocks over a standard index has...
Are you sure you want to block %USER_NAME%?
By doing so, you and %USER_NAME% will not be able to see any of each other's Investing.com's posts.
%USER_NAME% was successfully added to your Block List
Since you’ve just unblocked this person, you must wait 48 hours before renewing the block.
I feel that this comment is:
Thank You!
Your report has been sent to our moderators for review
Add a Comment
We encourage you to use comments to engage with other users, share your perspective and ask questions of authors and each other. However, in order to maintain the high level of discourse we’ve all come to value and expect, please keep the following criteria in mind:
Enrich the conversation, don’t trash it.
Stay focused and on track. Only post material that’s relevant to the topic being discussed.
Be respectful. Even negative opinions can be framed positively and diplomatically. Avoid profanity, slander or personal attacks directed at an author or another user. Racism, sexism and other forms of discrimination will not be tolerated.
Perpetrators of spam or abuse will be deleted from the site and prohibited from future registration at Investing.com’s discretion.