- All Instrument Types
- Indices
- Equities
- ETFs
- Funds
- Commodities
- Currencies
- Crypto
- Bonds
- Certificates
Please try another search

BRICS Currencies Reach Lowest Levels This Year Against the US Dollar

Talking Points:
- Risk aversion leads to selling pressure in emerging market assets and BRICS currencies
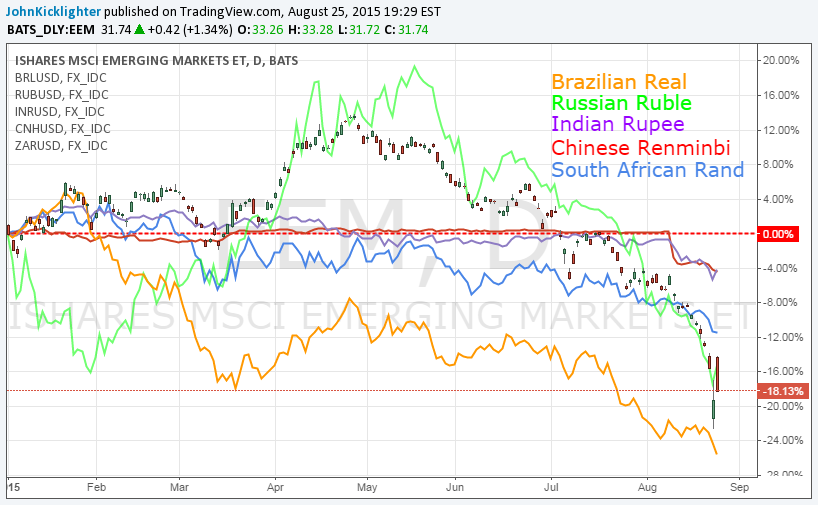
- BRICS currencies have fallen below their 2015 start vs the US dollar
- Global economic turmoil leading to “safe haven” trading
In full risk aversion, few assets can escape the need to reduce exposure to ‘risky’ assets and seek the shelter of ‘havens’. The recent slump in financial market benchmarks and surge in volatility looks like a genuine swell in fear. Towards the higher return but more perilous extreme of the spectrum is the collective of emerging market economies that promise more rapid growth and return on capital at the risk of illiquid conditions and sharp declines in output. While benchmarks like the S&P 500 may have grabbed the headlines, Emerging Markets measures have been in retreat longer and lost more ground overall.
BRICS is an acronym used to group together five of the largest emerging economies that are estimated to make the transition into a developed nation by 2050. The abbreviation stands for Brazil, Russia, India, China and South Africa. The association is meant for the countries to form interconnected economic growth and stability. Lately, their development has been constricted by global economic turmoil.
When the investors are in a state of high risk aversion – meaning traders are more concerned with saving money versus making a return – assets with considerable volatility tend to receive selling pressure. Money is then shifted to “safe haven” securities. Paired with the alert of risk aversion is the rout in commodities, lack of Chinese Demand and continued weakening of the Yuan – making imported goods more expensive. These factors may have encouraged investors to sell the currencies of the BRICS vs the greenback, as seen in the chart below.
Here is a list of upcoming event risk for the BRICS:
Brazil (BRL)
- July’s Total Outstanding Loans due 8/26 at 13:30 GMT. 3103B expected and 3102B in June.
- 2Q’s GDP YoY due 8/28 at 12:00 GMT. -2.1% expected and -1.6% in 1Q.
- August’s Markit Brazil PMI Manufacturing due 9/01 at 13:00 GMT. 47.2 in July.
Russia (RUB)
- (AUG 24) CPI WoW due 8/26 at 13:00 GMT. 0.0% prior.
- (AUG 21) Gold and Forex Reserve due 8/27 at 12:00 GMT. 362.9B prior
- August’s Markit PMI Manufacturing due 9/01 at 06:00 GMT. 48.3 in July.
India (INR)
- August’s Nikkei PMI Manufacturing due 9/01 at 05:00 GMT. 52.7 in July.
- August’s Nikkei PMI Services due 9/03 at 05:00 GMT. 50.8 in July.
- August’s Nikkei PMI Composite due 9/03 at 05:00 GMT. 52.0 in July.
China(CNY)
- August’s Manufacturing PMI due 9/01 at 01:00 GMT. 49.6 expected and 50.0 in July.
- August’s Trade Balance due 9/08. $43.03B in July.
- August’s CPI YoY due 9/09 at 01:30 GMT. 1.6% in July.
South Africa (ZAR)
- July’s PPI YoY due 8/27 at 09:30 GMT. 3.8% expected and 3.7% in June.
- July’s Trade Balance Rand due 8/31 at 12:00 GMT. 5.8B in June.
- August’s Barclays Manufacturing PMI due 9/01 at 09:00 GMT. 51.4 in July.
Related Articles

MON: Eurogroup Meeting, Norwegian CPI (Feb), EZ Sentix Index (Mar), Japanese GDP (Q4) TUE: EIA STEO WED: 25% US tariff on all imports of steel and aluminium comes into effect,...

Brief Reminder In 2018, US President Donald Trump initiated a trade war update with sanctions against China. Economic disagreement between the United States and China began in...

Trump’s U-Turns Keep the Market Under Pressure Both US equity indices and the US dollar remain under severe stress as US President Trump continues his back-and-forth on the...
Are you sure you want to block %USER_NAME%?
By doing so, you and %USER_NAME% will not be able to see any of each other's Investing.com's posts.
%USER_NAME% was successfully added to your Block List
Since you’ve just unblocked this person, you must wait 48 hours before renewing the block.
I feel that this comment is:
Thank You!
Your report has been sent to our moderators for review


Add a Comment
We encourage you to use comments to engage with other users, share your perspective and ask questions of authors and each other. However, in order to maintain the high level of discourse we’ve all come to value and expect, please keep the following criteria in mind:
Enrich the conversation, don’t trash it.
Stay focused and on track. Only post material that’s relevant to the topic being discussed.
Be respectful. Even negative opinions can be framed positively and diplomatically. Avoid profanity, slander or personal attacks directed at an author or another user. Racism, sexism and other forms of discrimination will not be tolerated.
Perpetrators of spam or abuse will be deleted from the site and prohibited from future registration at Investing.com’s discretion.