


Sign up to create alerts for Instruments,
Economic Events and content by followed authors
Free Sign Up Already have an account? Sign In
Please try another search

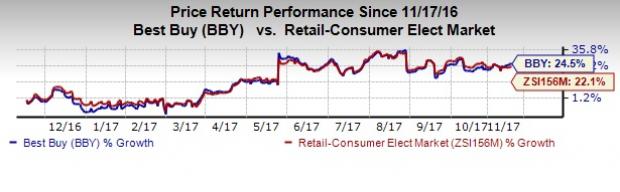
Best Buy Company, Inc. (NYSE:BBY) reported lower-than-expected results in third-quarter fiscal 2018. We noted that the company’s earnings missed the Zacks Consensus Estimate after beating the same in the preceding 19 quarters in a row. Following the results, the company’s shares are down nearly 3% in the pre-market trading session. However, the stock has surged 24.5% in a year, outperforming the industry’s rally of 22.1%.
The company posted adjusted earnings per share of 78 cents from continuing operations, lagging the Zacks Consensus Estimate by a penny. However, the bottom line increased 30% year over year, which came as a big boost to investors.
The company also missed revenue estimates after surpassing the same in the trailing two quarters. However, the top line increased 4.2% year over year to $9,320 million but missed the consensus mark of $9,353 million. Enterprise comparable-store sales (comps) were up 4.4% compared with a gain of 1.8%. reported in the prior-year period.
The company’s lower-than-expected performance were due to lack of new launches of mobile, which impacted the revenues by $100 million and the blows of hurricanes in south Texas, Florida, Puerto Rico and Mexico. These factors affected the overall revenues by 15 to 20 basis points and the earnings per share by nearly 3 cents.
Best Buy Co., Inc. Price, Consensus and EPS Surprise
Other Financial Details
Best Buy ended the quarter under review with cash and cash equivalents of $1,103 million, long-term debt of $784 million and total equity of $4,152 million.
On Mar 1, 2017, the board of directors announced a plan to repurchase shares worth $3 billion over the next couple of years. In the fiscal second quarter, the company repurchased 6.4 million shares for $367 million.
Guidance
Despite missing both the top and the bottom line in the reported quarter, the company raised its fiscal 2018 guidance. For fiscal 2018, management forecasts Enterprise revenue (including 53rd week) growth of 4-4.8%, up from the prior projection of 4%. The company anticipates adjusted operating income (including 53rd week) growth rate in the 7-9.5% range, up from the earlier guided range of 4-9%. Meanwhile, on a 52-week basis, the company expects enterprise revenues and adjusted operating income growth of 3% and 2-6.5%, respectively.
For fourth-quarter fiscal 2018, management anticipates Enterprise revenues between $14.2 billion and $14.5 billion, and a comparable sales increase of 1-3%. Management also projects adjusted earnings in the band of $1.89-$1.99 cents a share. The Zacks Consensus Estimate is pegged at $2.03.
Also in the fiscal fourth quarter, the company expects domestic comparable sales to rise in the range of 1-3%, while international comparable sales are estimated in the band of flat to up 3%.
Best Buy carries a Zacks Rank #3 (Hold).
Interested in the Retail Space? Check These
Some better-ranked stocks worth considering from the retail space are American Eagle Outfitters, Inc. (NYSE:AEO) , Boot Barn Holdings, Inc. (NYSE:BOOT) and Shoe Carnival (LON:CCL), Inc. (NASDAQ:SCVL) , each carrying a Zacks Rank #2 (Buy). You can seethe complete list of today’s Zacks #1 Rank (Strong Buy) stocks here.
American Eagle Outfitters delivered an average positive earnings surprise of 3.9% in the trailing four quarters and has a long-term earnings growth rate of 8.7%.
Boot Barn Holdings has an impressive long-term earnings growth rate of 15.7%.
Shoe Carnival delivered an average beat of 20% in the last four quarters and has a long-term earnings growth rate of 12%.
Zacks’ Best Private Investment Ideas
While we are happy to share many articles like this on the website, our best recommendations and most in-depth research are not available to the public.
Starting today, for the next month, you can follow all Zacks' private buys and sells in real time. Our experts cover all kinds of trades… from value to momentum . . . from stocks under $10 to ETF and option moves . . . from stocks that corporate insiders are buying up to companies that are about to report positive earnings surprises. You can even look inside exclusive portfolios that are normally closed to new investors.
Click here for Zacks' private trades >>
Investors are on edge about what tariff policy means for markets Coming off a strong Q4 earnings season, fresh February corporate sales figures can help assess the macro...
Broadcom stock is in a dynamic rebound phase. Markets seem optimistic ahead of the earnings release. Let's take a deep dive into what to expect from the report. Get the...
Consumers are feeling the pinch from inflation every time they go to the grocery store. Money is a zero-sum game; as disposable income and buying power erodes, consumers are...
Are you sure you want to block %USER_NAME%?
By doing so, you and %USER_NAME% will not be able to see any of each other's Investing.com's posts.
%USER_NAME% was successfully added to your Block List
Since you’ve just unblocked this person, you must wait 48 hours before renewing the block.
I feel that this comment is:
Thank You!
Your report has been sent to our moderators for review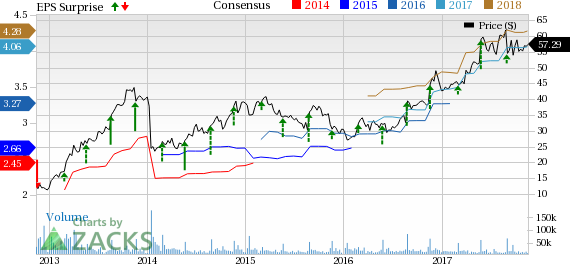

Add a Comment
We encourage you to use comments to engage with other users, share your perspective and ask questions of authors and each other. However, in order to maintain the high level of discourse we’ve all come to value and expect, please keep the following criteria in mind:
Enrich the conversation, don’t trash it.
Stay focused and on track. Only post material that’s relevant to the topic being discussed.
Be respectful. Even negative opinions can be framed positively and diplomatically. Avoid profanity, slander or personal attacks directed at an author or another user. Racism, sexism and other forms of discrimination will not be tolerated.
Perpetrators of spam or abuse will be deleted from the site and prohibited from future registration at Investing.com’s discretion.