


Sign up to create alerts for Instruments,
Economic Events and content by followed authors
Free Sign Up Already have an account? Sign In
Please try another search

Applied Materials Inc. (NASDAQ:AMAT) reported robust fiscal fourth-quarter 2017 results, with both the top and the bottom lines surpassing the Zacks Consensus Estimate.
The company’s pro forma earnings per share (EPS) of 93 cents beat the consensus mark by 2 cents and came in toward the higher end of the guided range of 86-94 cents. Earnings were up 8.1% sequentially and 40.9% year over year.
Revenues of $3.97 billion beat the consensus mark by $40 million and were at the high end of the guided range of $3.85-$4 billion. Revenues increased 6% sequentially and 20.4% year over year. The revenue growth was backed by higher demand in most of the regions.
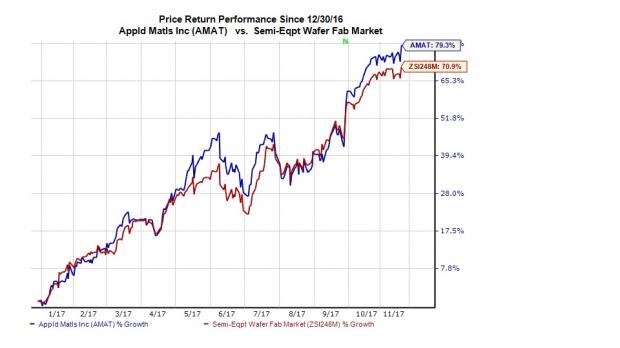
Following the strong fiscal fourth-quarter results, the company’s share price increased 1.8%. Shares have increased a massive 79.3% year to date, slightly outperforming the industry’s gain of 70.9%.
This quarter Applied Materials’ revenues and earnings were at an all-time high. Inflection-focused innovation strategy was the primary growth driver. The company continues to witness technological advancements in semiconductor and display areas. 3D NAND, DRAM and patterning have led to significant market share gains.
Applied Materials has well-differentiated products and high market share in foundry and logic. It is significantly improving on its memory market share as well. Management expects robust double-digit growth in semiconductor, display and service businesses in 2018. It expects wafer fab equipment (WFE) spending in 2017 and 2018 combined to be well above the previous forecast of $90 billion.
Applied Materials remains strongly positioned in China where it continues to witness robust growth in semiconductor and display. Growing investments from Chinese domestic manufacturers have been the main catalysts.
Notably, the company has gained considerable success in expanding beyond semiconductors, particularly in display. Mobile OLEDs and large screen televisions are opening new market opportunities for Applied Materials.
Applied Materials sees significant opportunities from emerging trends on the semiconductor and display fronts such as artificial intelligence, big data, cloud infrastructure, Internet of Things (IoT), virtual reality and smart vehicles.
We believe that Applied Materials is in a great position to grow sustainably and profitably based on its strong pipeline of enabling technologies, supported by expanding opportunities on the semiconductor, service and display fronts.
Let’s delve deeper into the numbers.
Revenues by Segment
The Semiconductor Systems Group (SSG) contributed 61.3% of revenues, reflecting a decrease of 4% sequentially but increase of 14.3% year over year.
The second-largest contributor was Applied Global Services (AGS) with 20.9% revenue share. Segment revenues increased 5.7% sequentially and 19.9% year over year.
The Display segment was up 65.1% from the last quarter and 49.8% from the year-ago level, contributing 17.1% to revenues.
Revenues by Geography
Korea contributed 30% to revenues, Taiwan 18%, China 15%, Japan 13% and U.S. 10%. Southeast Asia contributed 8%, while Europe contributed 6%.
On a sequential basis, China and Korea were the weakest, declining 22.9% and 7.1% respectively. All the other regions improved sequentially.
On a year-over-year basis, Taiwan and Europe decreased 37.8% and 11.3%, respectively. All the other regions increased.
Applied Materials, Inc. Revenue (TTM)
Margins
Pro forma gross margin was 46.2%, down 42 basis points (bps) sequentially but up 245 bps from the year-ago quarter.
Applied Materials’ adjusted operating expenses of $700 million increased 4.9% sequentially and 14.9% from the year-ago quarter. Operating margin of 28.5% decreased 24 bps sequentially but increased 329 bps year over year.
Net Profit
On a pro-forma basis, Applied Materials reported net income of $1 billion, or 93 cents per share compared with $927 million or 86 cents in the prior quarter. In the year-ago quarter, Applied Materials had reported net income of $722 million or 66 cents per share.
Our pro-forma calculation excludes restructuring, acquisition-related, impairment and other charges as well as tax adjustments in the reported quarter.
On a GAAP basis, the company registered net profit of $982 million (91 cents per share) compared with $925 million (85 cents per share) in the previous quarter and $610 million (56 cents per share) a year ago.
Balance Sheet
At the end of fiscal fourth quarter, inventories increased to $2.93 billion from $2.88 billion in the previous quarter. Accounts receivables increased to $2.34 billion from $2.26 in the prior quarter.
Cash and cash equivalents balance was $5.01 billion compared with $5.28 billion in the prior quarter. Goodwill was 17.3% of the total assets.
The company generated $699 million in cash from operations. The company spent $124 million on capex and returned $492 million through stock repurchases and cash dividends to shareholders.
Guidance
Applied Materials also provided guidance for the first quarter of fiscal 2018. Revenues are expected between $4.00 and $4.20 billion, better than the Zacks Consensus Estimate of $3.96 billion. Non-GAAP EPS is expected to come in the range of 94 cents to $1.02, higher than the consensus mark of 91 cents.
Zacks Rank and Other Picks
Applied Materials carries a Zacks Rank 2 (Buy). You can see the complete list of today’s Zacks #1 Rank (Strong Buy) stocks here.
Other stocks worth considering in the broader technology sector include Activision Blizzard, (NASDAQ:ATVI) , Baidu (NASDAQ:BIDU) and Alibaba (NYSE:BABA) , all carrying the same Zacks Rank as Applied Materials.
Long-term earnings per share growth rate for Activision, Baidu and Alibaba is projected to be 13.8%, 23.7% and 30.7%, respectively.
Looking for Stocks with Skyrocketing Upside?
Zacks has just released a Special Report on the booming investment opportunities of legal marijuana.
Ignited by new referendums and legislation, this industry is expected to blast from an already robust $6.7 billion to $20.2 billion in 2021. Early investors stand to make a killing, but you have to be ready to act and know just where to look.
See the pot trades we're targeting>>
As the digital economy starts to go online across businesses and the world, investors have to be aware of the companies and services that will be at the forefront of this...
Wall Street Indexes remain under pressure today but have held above the lows we saw on Tuesday as the Trump administration tariffs came into force. The announcement of tariffs on...
These stocks provide a compelling case as safe-haven stocks in the face of an escalating trade war. Each company operates within sectors that are relatively resilient to economic...
Are you sure you want to block %USER_NAME%?
By doing so, you and %USER_NAME% will not be able to see any of each other's Investing.com's posts.
%USER_NAME% was successfully added to your Block List
Since you’ve just unblocked this person, you must wait 48 hours before renewing the block.
I feel that this comment is:
Thank You!
Your report has been sent to our moderators for review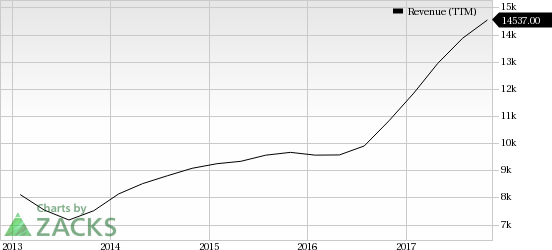

Add a Comment
We encourage you to use comments to engage with other users, share your perspective and ask questions of authors and each other. However, in order to maintain the high level of discourse we’ve all come to value and expect, please keep the following criteria in mind:
Enrich the conversation, don’t trash it.
Stay focused and on track. Only post material that’s relevant to the topic being discussed.
Be respectful. Even negative opinions can be framed positively and diplomatically. Avoid profanity, slander or personal attacks directed at an author or another user. Racism, sexism and other forms of discrimination will not be tolerated.
Perpetrators of spam or abuse will be deleted from the site and prohibited from future registration at Investing.com’s discretion.