


Sign up to create alerts for Instruments,
Economic Events and content by followed authors
Free Sign Up Already have an account? Sign In
Please try another search

Shares of Amazon.com Inc. (NASDAQ:AMZN) touched a new 52-week high of $1,213.41, eventually closing the day at $1,186.00. Amazon has gained 59.8% year to date, substantially outperforming the 16.7% rally of the S&P 500.
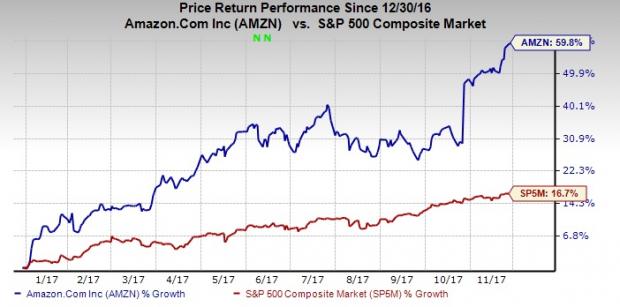
E-commerce behemoth Amazon organized back-to-back online shopping extravaganzas, with lower prices, free shipping and product availability and it turned to be more profitable than ever, leading the stock to a new 52-week high.
Cyber Monday
For Cyber Monday, more than 30 ‘Deals for the Day’ and a number of ‘Lightning Deals’ were listed on Amazon. PlayStation 4 was among the few products that were heavily discounted. Attractive deals were also offered on Amazon devices, electronics, toys, home appliances and footwear.
Strong economic indicators like record job data and declining unemployment rate are encouraging shoppers to spend more online. Adobe Analytics expects this year’s Cyber Monday to be the biggest-ever U.S. online shopping day with roughly $6.6 billion of sales.
Amazon.com, Inc. Price and Consensus
It’s a known fact that Amazon’s retail business is hard to beat on price, choice and convenience. It currently offers 480 million plus products of various brands. It has established its brand loyalty through its Prime and Fulfillment by Amazon (FBA) strategy.
Around 50 million products qualify for free two-day shipping to Prime members. Moreover, Prime Air, Trucks, pickup locations, artificial intelligence boost logistics at Amazon. Regular content addition to its online video streaming platform has helped to increase Prime memberships.
Thanksgiving and Black Friday Sales
According to Adobe Analytics, online sales during Thanksgiving and Black Friday hit all-time highs. U.S. retailers garnered $7.9 billion from Thanksgiving and Black Friday combined sales, up 17.9% year over year.
Per GBH Insights, the retailer Amazon dominated online sales during Black Friday and accounted for 45-50% sales. The company raked in more than $1 billion sales in just 24 hours. Amazon stated that on Thanksgiving day, orders via mobiles increased more than 50% than the year-ago period.
Thanksgiving sales were up 18.3% year over year to $2.9 billion while Black Friday, the biggest shopping day in America, sales increased 16.9% to $5 billion. It is estimated that Amazon accounted for 50% of all e-commerce sales on Black Friday. Smartphones accounted for the majority of the sales.
According to Criteo, 40% of the purchases came from mobile on Black Friday, up 17.9% year over year. Also Prime membership program sales were remarkable. Prime members have spent more 25% more compared with the last year. (Read More at Amazon Leading Record-Breaking Start to Holiday Season)
Zacks Rank & Stocks to Consider
Amazon currently carries a Zacks Rank #3 (Hold).
Intel Corp. (NASDAQ:INTC) , IPG Photonics Corp. (NASDAQ:IPGP) and NVIDIA Corp. (NASDAQ:NVDA) are three better-ranked stocks in the broader technology sector. All of them sport a Zacks Rank #1 (Strong Buy). You can see the complete list of today’s Zacks #1 Rank stocks here.
Long-term earnings growth for Intel, IPG Photonics and NVIDIA are currently projected to be 8.4%, 19.67% and 11.2%, respectively.
Today's Stocks from Zacks' Hottest Strategies
It's hard to believe, even for us at Zacks. But while the market gained +18.8% from 2016 - Q1 2017, our top stock-picking screens have returned +157.0%, +128.0%, +97.8%, +94.7%, and +90.2% respectively.
And this outperformance has not just been a recent phenomenon. Over the years it has been remarkably consistent. From 2000 - Q1 2017, the composite yearly average gain for these strategies has beaten the market more than 11X over. Maybe even more remarkable is the fact that we're willing to share their latest stocks with you without cost or obligation.
Two weeks ago, the rumor mill ramped up again about the potential restructuring of Intel Corporation (NASDAQ:INTC). The probing balloons centered around Taiwan Semiconductor...
More than a century ago, then-Representative William McKinley pursued an aggressive tariff strategy that sought to protect American industry and reduce reliance on foreign...
Early in 2025, value stocks emerged as a popular choice among investors seeking market-beating returns. However, factor-based investing strategies can be notoriously difficult to...
Are you sure you want to block %USER_NAME%?
By doing so, you and %USER_NAME% will not be able to see any of each other's Investing.com's posts.
%USER_NAME% was successfully added to your Block List
Since you’ve just unblocked this person, you must wait 48 hours before renewing the block.
I feel that this comment is:
Thank You!
Your report has been sent to our moderators for review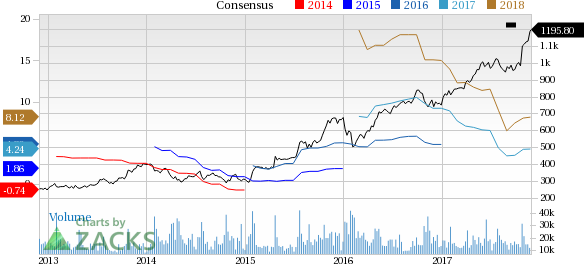

Add a Comment
We encourage you to use comments to engage with other users, share your perspective and ask questions of authors and each other. However, in order to maintain the high level of discourse we’ve all come to value and expect, please keep the following criteria in mind:
Enrich the conversation, don’t trash it.
Stay focused and on track. Only post material that’s relevant to the topic being discussed.
Be respectful. Even negative opinions can be framed positively and diplomatically. Avoid profanity, slander or personal attacks directed at an author or another user. Racism, sexism and other forms of discrimination will not be tolerated.
Perpetrators of spam or abuse will be deleted from the site and prohibited from future registration at Investing.com’s discretion.