


Sign up to create alerts for Instruments,
Economic Events and content by followed authors
Free Sign Up Already have an account? Sign In
Please try another search

Allscripts Healthcare Solutions, Inc. (NASDAQ:MDRX) reported fourth-quarter 2019 adjusted earnings per share (EPS) of 17 cents, which missed the Zacks Consensus Estimate of 18 cents by 5.6%. The bottom line also declined 5.6% on a year-over-year basis.
For the full-year 2019, the company reported earnings per share of 67 cents, down 1.5% from 2018.
Revenue Details
On a non-GAAP basis, revenues totaled $452 million, which lagged the Zacks Consensus Estimate by 1.5%. However, the top line improved 2.5% year over year. Moreover, on a reported basis, revenues amounted to $451 million in the quarter, reflecting year-over-year improvement of 2%.
For full-year 2019, the company reported net sales of $1.77 billion, up 1.2% from 2018.
For fourth-quarter 2019, bookings came in at $312 million, significantly up by 5.8% from the prior-year quarter.
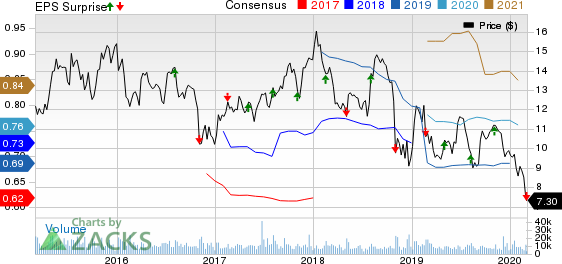
Allscripts Healthcare Solutions, Inc. Price, Consensus and EPS Surprise
 Allscripts Healthcare Solutions, Inc. Price, Consensus and EPS Surprise
Allscripts Healthcare Solutions, Inc. price-consensus-eps-surprise-chart | Allscripts Healthcare Solutions, Inc. Quote
Segment Details
In a bid to focus on the payer and life sciences market and evolution of the healthcare IT industry, the company realigned segment reporting structure by selling its stake in Netsmart on Dec 31, 2018.
The new Provider segment consists of the core integrated clinical software applications, financial management and patient engagement solutions targeted at clients across the entire continuum of care. Meanwhile, the new Veradigm segment primarily focuses on the payer and life sciences market.
Software delivery, Support and Maintenance
In the quarter under review, revenues at the segment amounted to $281.6 million on a reported basis, down 2.6% from the year-ago quarter's tally.
Client Services
At this segment, revenues totaled $169.4 million, up 10.6% from the year-ago quarter's figure.
Margins
Gross profit in the fourth quarter was $180.1 million, down 4.3% from the year-ago quarter. As a percentage of revenues, gross margin was 39.9%, down 260 bps from the year-ago figure.
Adjusted gross profit amounted to $191.9 million, down 3.9% year over year. Adjusted gross margin was 42.5%, down 280 bps from the prior-year quarter.
Adjusted operating income in the reported quarter was $43.9 million, down 3.5% year over year. Adjusted operating margin was 9.7%, as a percentage of revenues, down 60 bps from the prior-year quarter.
Financial Update
As of Dec 31, 2019, cash and cash equivalents totaled $129.6 million, down 25.6% from year-end 2018.
At the end of 2019, net cash provided by operating activities totaled $12.4 million against net cash used of $13.6 million at the end of 2018.
2020 Guidance
For 2020, adjusted EPS is expected in the range of 70-75 cents. The Zacks Consensus Estimate is pegged at 76 cents.
For the full-year 2020, revenues are estimated between $1.75 billion and $1.85 billion.
The company projects full-year bookings in the range of $900 million to $1 billion.
For first-quarter 2020, revenues are expected between $420 million and $430 million. The Zacks Consensus Estimate is pegged at $450.9 million. With respect to booking, the company anticipates the metric to be in the band of $175-$200 million.
Summing Up
Allscripts ended the fourth quarter on a weak note. The company continues to gain from the core Client Services unit, which exhibited better performance in the quarter. Growth in fourth-quarter bookings also instills investor optimism. The company continues to maintain momentum in its Provider business on the back of key client wins across solution set. The company remains confident about its near and long-term outlook as it anticipates to benefit from a number of differentiated growth opportunities in both its Provider and Veradigm businesses.
Notably, the company extended managed services agreement with Northwell Health through 2026.
Meanwhile, the company witnessed a contraction in both gross and operating margins in the reported quarter. Moreover, Allscripts is exposed to integration risks. Intense competition in the niche space remains a concern.
Zacks Rank
Currently, Allscripts carries a Zacks Rank #4 (Sell).
Earnings of Other MedTech Majors at a Glance
Some better-ranked stocks that reported solid results this earning season are Stryker Corporation (NYSE:SYK) , Accuray Incorporated (NASDAQ:ARAY) and IDEXX Laboratories, Inc. (NASDAQ:IDXX) , each carrying a Zacks Rank of 2 (Buy). You can see the complete list of today’s Zacks #1 Rank (Strong Buy) stocks here.
Stryker delivered fourth-quarter 2019 adjusted EPS of $2.49, outpacing the Zacks Consensus Estimate by 1.2%. Fourth-quarter reported revenues of $4.13 billion surpassed the Zacks Consensus Estimate by 0.7%.
Accuray reported second-quarter fiscal 2020 adjusted earnings per share (EPS) of a penny, beating the Zacks Consensus Estimate of a loss of 7 cents. Net revenues of $98.8 million outpaced the Zacks Consensus Estimate by 0.3%.
IDEXX Laboratories reported fourth-quarter 2019 adjusted EPS of $1.04, which beat the Zacks Consensus Estimate of 91 cents by 14.3%. Revenues were $605.4 million, surpassing the Zacks Consensus Estimate by 0.9%.
Today's Best Stocks from Zacks
Would you like to see the updated picks from our best market-beating strategies? From 2017 through 2019, while the S&P 500 gained and impressive +53.6%, five of our strategies returned +65.8%, +97.1%, +118.0%, +175.7% and even +186.7%.
This outperformance has not just been a recent phenomenon. From 2000 – 2019, while the S&P averaged +6.0% per year, our top strategies averaged up to +54.7% per year.
See their latest picks free >>
• Trump’s trade war, inflation data, and last batch of earnings will be in focus this week. • DoorDash’s imminent inclusion in the S&P 500 is likely to trigger a wave of...
The big US stocks dominating markets and investors’ portfolios just finished another earnings season. They reported spectacular collective results including record sales, profits,...
“Quality” stocks with strong fundamentals tend to be rewarding places to stash hard-earned money. Since 2009, investing in a basket of quality stocks over a standard index has...
Are you sure you want to block %USER_NAME%?
By doing so, you and %USER_NAME% will not be able to see any of each other's Investing.com's posts.
%USER_NAME% was successfully added to your Block List
Since you’ve just unblocked this person, you must wait 48 hours before renewing the block.
I feel that this comment is:
Thank You!
Your report has been sent to our moderators for review
Add a Comment
We encourage you to use comments to engage with other users, share your perspective and ask questions of authors and each other. However, in order to maintain the high level of discourse we’ve all come to value and expect, please keep the following criteria in mind:
Enrich the conversation, don’t trash it.
Stay focused and on track. Only post material that’s relevant to the topic being discussed.
Be respectful. Even negative opinions can be framed positively and diplomatically. Avoid profanity, slander or personal attacks directed at an author or another user. Racism, sexism and other forms of discrimination will not be tolerated.
Perpetrators of spam or abuse will be deleted from the site and prohibited from future registration at Investing.com’s discretion.