


Sign up to create alerts for Instruments,
Economic Events and content by followed authors
Free Sign Up Already have an account? Sign In
Please try another search

Agilent Technologies’ (NYSE:A) fiscal fourth-quarter 2017 earnings per share of 67 cents beat the Zacks Consensus Estimate by 4 cents. Earnings increased 14% year over year.
Following the fiscal fourth-quarter earnings results, share price has increased 1.7%. However, it was down 4.53% in after-hours trading due to weaker-than-expected earnings guidance for the upcoming quarter.
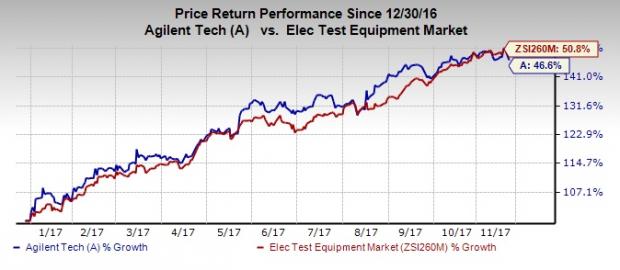
Also, the company’s shares are down 46.6% year to date, underperforming the industry’s gain of 50.8%.
During the quarter, the company said that the integration of U.K.-based Cobalt Light Systems is on track. It will strengthen Agilent’s presence in the high-growth Raman spectroscopy market. The deal complements Agilent’s product expansion efforts with the promise of helping it offer better services to its pharmaceutical and biopharma customers.
We also remain positive on Agilent’s broad-based portfolio and increased focus on segments with higher growth potential. Further, the company continues to introduce high-margin products.
Revenues
Agilent’s fiscal fourth-quarter 2017 revenues of $1.19 billion increased 8% sequentially and 7% year over year. Revenues were above the management’s guided range of $1.15-$1.17 billion and the Zacks Consensus Estimate of $1.17 billion.
Revenue growth was supported by strong growth across all product lines with particular strength in Europe and Americas.
Revenues by Segment
Agilent now has three reporting segments — Life Sciences & Applied Markets Group (LSAG), Agilent Cross Lab Group (ACG) and Diagnostics and Genomics Group (DGG). Its Electronic Measurement Group (EMG) segment was spun off as Keysight Technologies, an independent publicly traded company. Agilent also exited the Nuclear Magnetic Resonance business after failing to meet growth and profitability goals. The company divested or shut down underperforming units to streamline operations.
In the reported quarter, LSAG was the largest contributor and accounted for $573 million or 49% of total revenues, reflecting an increase of 5% year over year. This was driven by strong performances in the chemical and energy, academia, government and food end markets.
Revenues from ACG came in at $404 million or 34% of total revenues, reflecting a increase of 9% year over year. Both services and consumables witnessed growth across all geographical regions.
Non-GAAP revenues from DGG came in at $208 million or remaining 18% of total revenues. The segment was up 9% year over year, driven by strong demand for pathology products and companion diagnostics services.
Margins
The pro forma gross margin for the quarter was 56.1%, up 100 basis points (bps) sequentially and 70 bps year over year.
Operating expenses (research & development and selling, general & administrative expenses) in the quarter were $393 million, 7% higher than the year-ago quarter. As a result, adjusted operating margin was 23.3%, increasing 0.8% from the year-ago quarter of 22.5%.
Net Income
Agilent generated pro forma net income of $218 million (67 cents per share) compared with $193 million (59 cents) in the year-ago quarter. Our pro forma estimate excludes acquisition-related costs, restructuring charges, amortization of intangibles and other one-time items as well as tax adjustments.
With these above-mentioned items included, GAAP net income was $177 million (54 cents per share) compared with $126 million (38 cents) in the year-ago quarter.
Balance Sheet
Exiting the fiscal fourth quarter, inventories were $575 million, up from $566 in the prior quarter. Agilent’s long-term debt was $1.80 billion at the end of the quarter. Cash and cash equivalents were $2.68 billion compared with $2.56 billion in the prior quarter.
Net cash provided by operating activities was $288 million and capital expenditure was $58 million.
In the reported quarter, the company paid $43 million in dividends. There was no share repurchase activity during that time.
Guidance
Agilent provided guidance for fiscal first quarter of 2018.
Agilent expects revenues between $1.145 billion and $1.165 billion, and non-GAAP earnings per share in the range of 55-57 cents for the fiscal first quarter. Analysts polled by Zacks expect revenues of $1.14 billion and earnings of 60 cents per share.
For fiscal 2018, Agilent projects revenues in the range of $4.720-$4.740 billion and non-GAAP earnings per share in the range of $2.50-$2.56.
Analysts polled by Zacks expect earnings of $2.59 per share and revenues to the tune of $4.72 billion.
Agilent Technologies, Inc. Price, Consensus and EPS Surprise
Zacks Rank and Stocks to Consider
Currently, Agilent has a Zacks Rank #3 (Hold). A few better-ranked stocks in the broader technology sector are NVIDIA Corporation (NASDAQ:NVDA) and SMART Global Holdings, Inc. (NASDAQ:SGH) , both carrying a Zacks Rank #1 (Strong Buy), while Applied Materials, Inc. (NASDAQ:AMAT) , carrying a Zacks Rank #2 (Buy). You can see the complete list of today’s Zacks #1 Rank stocks here.
Long-term earnings per share growth rate for NVIDIA Corporation, SMART Global and Applied Materials is projected to be 11.2%, 15% and 16.9%, respectively.
Zacks' Hidden Trades
While we share many recommendations and ideas with the public, certain moves are hidden from everyone but selected members of our portfolio services. Would you like to peek behind the curtain today and view them?
Starting now, for the next month, I invite you to follow all Zacks' private buys and sells in real time from value to momentum...from stocks under $10 to ETF to option movers...from insider trades to companies that are about to report positive earnings surprises (we've called them with 80%+ accuracy). You can even look inside portfolios so exclusive that they are normally closed to new investors.
Click here for Zacks' secret trade>>
Walgreens Boots Alliance Inc. (NASDAQ:WBA) is on the brink of a significant transformation as it nears a deal with Sycamore Partners to become a private entity. The transaction,...
Using the Elliott Wave Principle (EWP), we have been successfully tracking the most likely path forward for the S&P 500 (SPX) over several months. Although there are many ways...
When looking for dividend stocks, high dividend yields are one important factor to consider. Even if a company’s dividend yield isn’t nearing double-digit percentages, finding...
Are you sure you want to block %USER_NAME%?
By doing so, you and %USER_NAME% will not be able to see any of each other's Investing.com's posts.
%USER_NAME% was successfully added to your Block List
Since you’ve just unblocked this person, you must wait 48 hours before renewing the block.
I feel that this comment is:
Thank You!
Your report has been sent to our moderators for review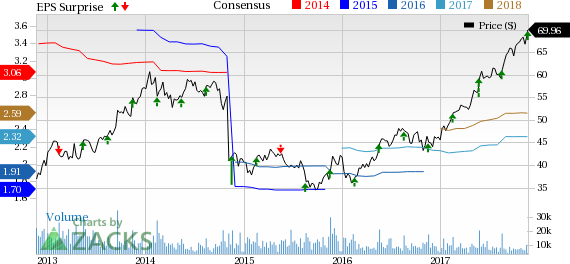

Add a Comment
We encourage you to use comments to engage with other users, share your perspective and ask questions of authors and each other. However, in order to maintain the high level of discourse we’ve all come to value and expect, please keep the following criteria in mind:
Enrich the conversation, don’t trash it.
Stay focused and on track. Only post material that’s relevant to the topic being discussed.
Be respectful. Even negative opinions can be framed positively and diplomatically. Avoid profanity, slander or personal attacks directed at an author or another user. Racism, sexism and other forms of discrimination will not be tolerated.
Perpetrators of spam or abuse will be deleted from the site and prohibited from future registration at Investing.com’s discretion.