


Sign up to create alerts for Instruments,
Economic Events and content by followed authors
Free Sign Up Already have an account? Sign In
Please try another search

AECOM (NYSE:ACM) reported fourth-quarter fiscal 2017 results, wherein adjusted earnings per share came in at 74 cents, beating the Zacks Consensus Estimate of 71 cents. Also, the bottom line was 13.8% higher than the year-ago tally of 65 cents. The improvement was primarily attributable to the company’s impressive top-line performance.
However, for fiscal 2017, the company’s adjusted earnings fell 2% to $2.94 from the prior-year tally.
Revenue Performance
For the fiscal fourth quarter, revenues increased 12.3% year over year to $4,856.4 million and beat the Zacks Consensus Estimate of $4,674 million. Further, the company achieved 9% organic growth in the fiscal fourth quarter, which was the highest in several years. The impressive performance of Building Construction and Power business, along with improved performance of Oil & Gas business proved favorable for the top line.
For fiscal 2017, the company’s top line increased 4.6% to a record $18,203.4 million from the year-ago tally of $17,410.8 million.
Segment wise, Design & Consulting Services (DCS) revenues rose 4.6% year over year to $1,995 million. On a constant-currency basis, organic revenues increased 4% due to improved performance in the Americas driven by transportation and water markets.
Construction Services (CS) revenues surged 26.3% to $1,971 million on a year-over-year basis. Stellar performance in the building construction and Power businesses drove the impressive performance.
This apart, Management Services (MS) revenues registered a year-over-year increase of 3.9% to $890.4 million.
Moreover, AECOM’s adjusted operating income in the fiscal fourth quarter was $199 million, up from the year-ago tally of $186.8 million. New order wins in the quarter totaled $4.9 billion. Also, AECOM’s total book-to-burn ratio during the quarter was 0.9%, with significant contribution from the DCS Americas and Management Services businesses.
At the end of the fiscal fourth quarter, AECOM’s total backlog was at an all-time high of $47.5 billion, up 11%, driven by the higher-margin DCS and MS segments. This included record backlog in the DCS segment and a whopping 47% growth in MS segment. Further, the recent Shimmick acquisition contributed about $1.4 billion to the backlog.
Liquidity & Cash Flow
As of Sep 30, 2017, AECOM’s cash and cash equivalents totaled $802.4 million compared with $692.1 million as of Sep 30, 2016. Total debt was $3,896.4 million compared with $4,125.3 million on Sep 30, 2016.
In the fiscal fourth quarter, AECOM generated free cash flow of $231.4 million, down 29% year over year. For fiscal 2017, the company’s free cash flow totaled $618.2 million, compared with $677.4 million in fiscal 2016.
2018 Guidance
Concurrent with the earnings release, AECOM provided its fiscal 2018 guidance. The company expects adjusted earnings per share to be in the range of $2.50-$2.90, which reflects a growth of 10% at the mid-point. This figure includes roughly 20 cents of anticipated gains related to AECOM Capital realizations.
In terms of spending, the company projects to incur interest expense (excluding amortization of deferred financing fees) of $210 million and capital expenditures of $110 million.
Our Take
AECOM ended fiscal 2017 on a rather impressive note, with both the top and the bottom line surpassing expectations. Robust cash flow, record backlog, and accelerating revenue growth proved conductive to the company’s growth.
However, this Zacks Rank #4 (Sell) company’s business is affected by the uncertain global political and economical conditions. For instance, the economic slowdown in China poses a major threat.
Moreover, AECOM is facing certain challenges in certain end markets that might weigh on its near-term financial performance. The company believes that economic conditions in many of its end markets, including Canada, China and the Middle East, have weakened over time and may remain difficult in the near future, which might dent revenues.
Stocks to Consider
Some better-ranked stocks in the same space include Norbord Inc. (NYSE:OSB) , Jacobs Engineering Group Inc. (NYSE:JEC) and Willdan Group, Inc. (NASDAQ:WLDN) . While Norbord sports a Zacks Rank #1 (Strong Buy), Jacobs Engineering Group and Willdan Group carry a Zacks Rank #2(Buy) each. You can see the complete list of today’s Zacks #1 Rank stocks here.
Norbord has a decent earnings surprise history, surpassing estimates twice in the trailing four quarters with an average beat of 0.3%.
Jacobs Engineering Group has an impressive earnings surprise history, exceeding estimates thrice in the trailing four quarters with an average beat of 4.8%.
Willdan Group has an impressive earnings surprise history, exceeding estimates in the trailing four quarters with an average beat of 44.8%.
Today's Stocks from Zacks' Hottest Strategies
It's hard to believe, even for us at Zacks. But while the market gained +18.8% from 2016 - Q1 2017, our top stock-picking screens have returned +157.0%, +128.0%, +97.8%, +94.7%, and +90.2% respectively.
And this outperformance has not just been a recent phenomenon. Over the years it has been remarkably consistent. From 2000 - Q1 2017, the composite yearly average gain for these strategies has beaten the market more than 11X over. Maybe even more remarkable is the fact that we're willing to share their latest stocks with you without cost or obligation.
The big US stocks dominating markets and investors’ portfolios just finished another earnings season. They reported spectacular collective results including record sales, profits,...
“Quality” stocks with strong fundamentals tend to be rewarding places to stash hard-earned money. Since 2009, investing in a basket of quality stocks over a standard index has...
Palantir Technologies (NASDAQ:PLTR) continues to sell off. On March 6, PLTR stock fell over 10% on nearly double the daily volume, bringing its 30-day decline to over 27%. A drop...
Are you sure you want to block %USER_NAME%?
By doing so, you and %USER_NAME% will not be able to see any of each other's Investing.com's posts.
%USER_NAME% was successfully added to your Block List
Since you’ve just unblocked this person, you must wait 48 hours before renewing the block.
I feel that this comment is:
Thank You!
Your report has been sent to our moderators for review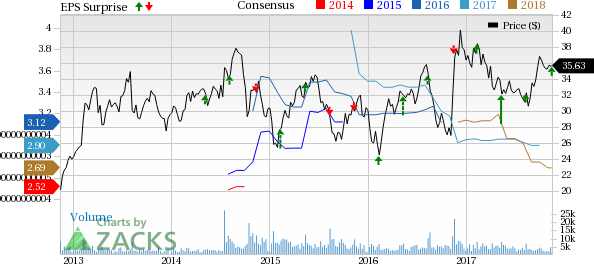

Add a Comment
We encourage you to use comments to engage with other users, share your perspective and ask questions of authors and each other. However, in order to maintain the high level of discourse we’ve all come to value and expect, please keep the following criteria in mind:
Enrich the conversation, don’t trash it.
Stay focused and on track. Only post material that’s relevant to the topic being discussed.
Be respectful. Even negative opinions can be framed positively and diplomatically. Avoid profanity, slander or personal attacks directed at an author or another user. Racism, sexism and other forms of discrimination will not be tolerated.
Perpetrators of spam or abuse will be deleted from the site and prohibited from future registration at Investing.com’s discretion.