


Sign up to create alerts for Instruments,
Economic Events and content by followed authors
Free Sign Up Already have an account? Sign In
Please try another search

Accenture plc (NYSE:ACN) recently reported better-than-expected first-quarter fiscal 2018 results. The company posted earnings of $1.79 per share, which came ahead of the Zacks Consensus Estimate of $1.66. Moreover, earnings increased from $1.58 per share reported in the year-ago quarter, mainly driven by higher revenues and lower share counts.
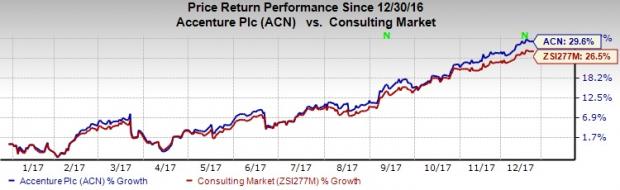
The Accenture stock has rallied 29.6% year to date, outperforming 26.5% growth recorded by the industry it belongs to.
Revenues and Bookings
Accenture’s fiscal first-quarter net revenues increased 12% year over year to $9.52 billion and surpassed the Zacks Consensus Estimate of $9.244 billion. In local currency terms, revenues grew 10% year over year. Net revenues also surpassed management’s guided range of $9.1 billion and $9.35.
The year-over-year increase was primarily driven by a 13% increase in Consulting revenues ($5.184 billion). Outsourcing revenues were up 11% on a year-over-year basis ($4.339 billion). It is worth mentioning that both Consulting revenues and Outsourcing revenues were up 11% and 9% in local currency, respectively.
Accenture PLC Price, Consensus and EPS Surprise
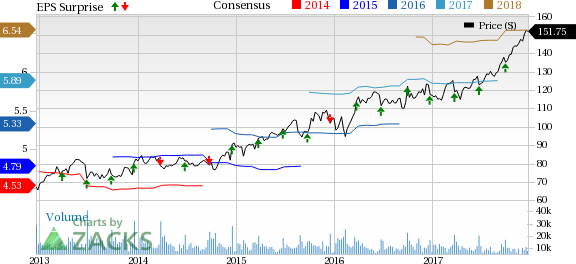
Accenture PLC Price, Consensus and EPS Surprise | Accenture PLC Quote
Balance Sheet & Cash Flow
Accenture exited the fiscal first quarter with a total Cash and cash equivalents of $3.68 billion compared with $4.13 billion in the preceding quarter. The company’s long-term debt balance at the end of the quarter was $22.2 million.
Operating cash flow for the quarter was $1.01 billion, while free cash flow was $872 million.
Share Repurchase and Dividend
In line with its policy of returning cash to shareholders, Accenture repurchased 4 million shares for $563 million during the fiscal first quarter. The company’s total remaining share repurchase authority as on Nov 30, 2017, was around $2.6 billion.
The company also paid a semi-annual cash dividend of $1.33 per share during the quarter.
Guidance
For second-quarter fiscal 2018, Accenture expects net revenues between $9.15 billion and $9.40 billion (mid-point $9.275 billion). The Zacks Consensus Estimate is pegged at $9.11 billion. The company did not provide any earnings per share guidance.
Accenture raised its lower-end revenue guidance range for fiscal 2018. The company now estimates net revenues to grow in the range of 6-8% in local currency compared with the previous predicted range of 5-8%.
Earnings per share on GAAP basis for fiscal 2018 are now projected in the range of $6.48-$6.66, up from the prior forecast of $6.36-$6.60. The Zacks Consensus Estimate is pegged at $6.54.
For fiscal 2018, the company expects operating margin in the range of 14.9-15.1%. The effective tax rate is projected to be in the range of 23-25%. Accenture expects operating cash flow of $5-$5.3 billion and free cash flow of $4.4-$4.7 billion.
Our Take
Accenture delivered impressive first-quarter results, wherein the top and bottom lines, both, surpassed the respective Zacks Consensus Estimate and marked year-over-year improvement. In addition, the company provided encouraging second-quarter and fiscal 2018 outlook.
The company’s long-term prospects look promising, driven by continued focus on innovative product roll outs, consistent investments in enhancing digital and marketing capabilities, along with major acquisitions. In addition, we believe regular acquisitions will significantly contribute to the revenue stream.
However, Accenture’s announcement of creating 15K new jobs by 2020, and investment plan of $1.4 billion for employee training and opening of 10 innovation centers across U.S. cities may dent its bottom-line results, in our opinion.
Additionally, increasing competition from peers such as Cognizant Technology Solutions (NASDAQ:CTSH) and IBM Corp. (NYSE:IBM) , and an uncertain macroeconomic environment may deter its growth to some extent.
Accenture currently has a Zacks Rank #2 (Buy).
A better-ranked stock in the same space includes Applied Materials, Inc. (NASDAQ:AMAT) , which sports a Zacks Rank #1 (Strong Buy). You can see the complete list of today’s Zacks #1 Rank stocks here.
Applied Materials has a long term-expected EPS growth rate of 12.7%.
Zacks’ Best Private Investment Ideas
While we are happy to share many articles like this on the website, our best recommendations and most in-depth research are not available to the public.
Starting today, for the next month, you can follow all Zacks' private buys and sells in real time. Our experts cover all kinds of trades… from value to momentum . . . from stocks under $10 to ETF and option moves . . . from stocks that corporate insiders are buying up to companies that are about to report positive earnings surprises. You can even look inside exclusive portfolios that are normally closed to new investors.
Click here for Zacks' private trades >>
The markets have been sluggish this week as investors hope for a jolt later in the week when AI juggernaut NVIDIA Corporation (NASDAQ:NVDA) reports fourth quarter and year-end...
On Friday, a wave of selling pressure swept across the US equity markets, leaving a trail of losses. The S&P 500 closed down 1.7%, the DOW slid 1.69%, and the NASDAQ tumbled a...
Palantir remains highly valued with a 460x P/E ratio and a 42.5x P/B ratio, far above its peers. The stock's beta of 2.81 signals high volatility, meaning sharp moves in both...
Are you sure you want to block %USER_NAME%?
By doing so, you and %USER_NAME% will not be able to see any of each other's Investing.com's posts.
%USER_NAME% was successfully added to your Block List
Since you’ve just unblocked this person, you must wait 48 hours before renewing the block.
I feel that this comment is:
Thank You!
Your report has been sent to our moderators for review
Add a Comment
We encourage you to use comments to engage with other users, share your perspective and ask questions of authors and each other. However, in order to maintain the high level of discourse we’ve all come to value and expect, please keep the following criteria in mind:
Enrich the conversation, don’t trash it.
Stay focused and on track. Only post material that’s relevant to the topic being discussed.
Be respectful. Even negative opinions can be framed positively and diplomatically. Avoid profanity, slander or personal attacks directed at an author or another user. Racism, sexism and other forms of discrimination will not be tolerated.
Perpetrators of spam or abuse will be deleted from the site and prohibited from future registration at Investing.com’s discretion.