


Sign up to create alerts for Instruments,
Economic Events and content by followed authors
Free Sign Up Already have an account? Sign In
Please try another search

‘Smart beta’ fever has gripped the ETF world with regular introductions of factor-based products. Simply put, hardly anyone takes interest in plain vanilla or market-cap weighted ETFs anymore as products need to dynamic in the fast-changing investing space (read: Behind Rise of Smart Beta Bond ETFs).
As the name suggests, this approach calls for a strategic take on portfolio construction rather than a market-cap oriented method. The approach helps exploit market anomalies by incorporating additional selection criteria to the market cap or rules-based indices. This enables them to generate market-beating returns. Many people call this an enhanced investing strategy.
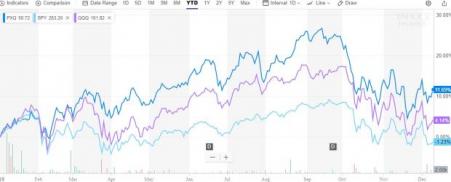
Overall, 2018 has been downbeat for stocks with SPDR S&P 500 ETF (NYSE:SPY) (AX:SPY) losing about 1.23% so far, SPDR Dow Jones Industrial Average (NYSE:DIA) ETF (V:DIA) losing about 1.23% and the tech-heavy Invesco QQQ Trust (QQQ) adding only 4.1%.
Escalating geo-political tensions, especially related to trade war, volatility in the oil patch and rising rate worries in the United States have been dampeners for the broader market. Against this backdrop, investors may be interested to know which smart-beta ETFs navigated this troubled time and managed to beat the broader market by a wide margin.
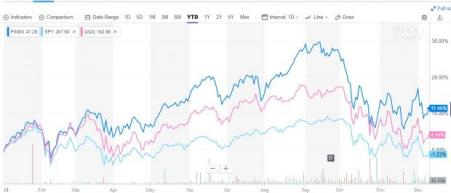
Invesco Dynamic Software ETF PSJ — Up 23.7%
The underlying index of the fund comprises stocks of software companies. The Index looks to provide capital appreciation by thoroughly evaluating companies based on a variety of investment merit criteria, including fundamental growth, stock valuation, investment timeliness and risk factors.
The tech fund managed to score higher despite huge tech selloffs at the beginning of the year on Facebook’s (FB) data debacle and in the months of October and November on overvaluation and rising rate concerns (read: Top Sector ETFs of 2018).

Invesco DWA Utilities Momentum ETF PUI — Up 13.1%
The underlying DWA Utilities Technical Leaders Index identifies companies that are showing relative strength and are composed of at least 30 common utility stocks.
As long-term yields skidded at the end of 2018, rate-sensitive sector, utility, benefited a great deal. Investors should note this safe-haven sector has received enough boost from rising trade tensions between the United States and China in 2018.

ProShares Long Online/Short Stores ETF CLIX— Up 11.97%
The fund’s underlying index consists of long positions in online retailers included in the ProShares Online Retail Index and short positions in bricks and mortar retailers on the Solactive-ProShares Bricks and Mortar Retail Store Index.
Consumers’ confidence remained steady in the United States, courtesy of upbeat job market and increased online shopping. The retail landscape is changing, with online sales gradually taking control.
Online retailing is likely to hit a home run this holiday season as evident from upbeat Thanksgiving and Black Friday data. Sales on web jumped 28% to a record $3.7 billion and 23.6% to $6.22 billion on these two events, respectively (read: Holiday Season 2018 Should Make This ETF Jump in Joy).

Invesco Dynamic Networking ETF PXQ — Up 11.7%
This one consists of networking companies screened on the criteria of fundamental growth, stock valuation, investment timeliness and risk factors. This is yet another tech winner in the downtrodden 2018 (read: Tech ETFs to Give Thanks Amid Bloodbath).
Invesco Russell Mid-Cap Pure Growth ETF PXMG — Up 11.5%
While a strong greenback and trade tensions put large-cap stock investing in a precarious situation this year, overvaluation concerns weighed on small-cap investing at some point of 2018 (read: 5 ETF Suggestions for Festive December).
So, investors placed bets on mid-cap smart-beta ETF PXMG which offered the benefits of an upbeat U.S. economy and a rebound in some corners of the globe.
Want key ETF info delivered straight to your inbox?
Zacks’ free Fund Newsletter will brief you on top news and analysis, as well as top-performing ETFs, each week. Get it free >>
Through many years of frustration among gold bugs due to the failure of gold stock prices to leverage the gold prices in a positive way, there were very clear reasons for that...
• Trump’s trade war, inflation data, and last batch of earnings will be in focus this week. • DoorDash’s imminent inclusion in the S&P 500 is likely to trigger a wave of...
The big US stocks dominating markets and investors’ portfolios just finished another earnings season. They reported spectacular collective results including record sales, profits,...
Are you sure you want to block %USER_NAME%?
By doing so, you and %USER_NAME% will not be able to see any of each other's Investing.com's posts.
%USER_NAME% was successfully added to your Block List
Since you’ve just unblocked this person, you must wait 48 hours before renewing the block.
I feel that this comment is:
Thank You!
Your report has been sent to our moderators for review
Add a Comment
We encourage you to use comments to engage with other users, share your perspective and ask questions of authors and each other. However, in order to maintain the high level of discourse we’ve all come to value and expect, please keep the following criteria in mind:
Enrich the conversation, don’t trash it.
Stay focused and on track. Only post material that’s relevant to the topic being discussed.
Be respectful. Even negative opinions can be framed positively and diplomatically. Avoid profanity, slander or personal attacks directed at an author or another user. Racism, sexism and other forms of discrimination will not be tolerated.
Perpetrators of spam or abuse will be deleted from the site and prohibited from future registration at Investing.com’s discretion.