


Sign up to create alerts for Instruments,
Economic Events and content by followed authors
Free Sign Up Already have an account? Sign In
Please try another search

EUR/USD’s short-term recovery (worth almost 6%) remains under pressure below resistance at 1.3937 (which has not been breached on a close basis). Bears need to break 1.3653 (18th Oct swing low) and 1.3550 (50% Fib-04th Oct swing), to challenge that all-important psychological level at 1.3000 and unlock further scope into 1.2860 (near 2011 low).
Key resistance remains at 1.3937 (15th Sept high), which is near the previous breakout zone at 1.4000 and the long-term 200-day MA at 1.4092. Only a confirmation above here will neutralise the status quo.
Inversely, the USD Index is continuing to retrace (from its recent 6-month highs) and we expect support to hold at 75.80-55 for the next leg higher. Speculative (net long) liquidity flows are temporarily unwinding from their recent spike highs (3 standard deviations from the yearly average). This will remain strong and help resume the USD’s bull-run from its historic oversold extremes (momentum, sentiment and liquidity).
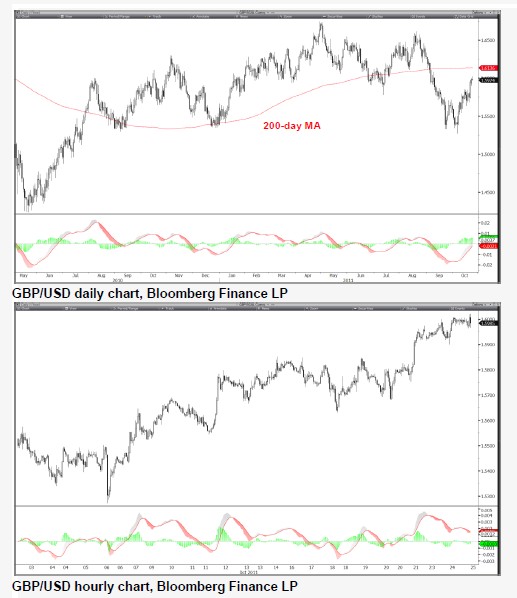
GBP/USD
Under 1.5632 to would turn to bearish bias.
GBP/USD is settling above the 38.2% retrace of the 1.6747-1.5272 fall. A sustained break under 1.5632 is now required to increase the probability of a lasting lower high near this key retrace.
Strategy is still hampered by a lack of reliable structure, largely due to the range bound nature of the market in the medium-term time frame. Should this continue then a larger recovery phase, back towards the 200 day moving average would come back into focus. Remaining neutral is deemed best for now.
GBP/USD has already experienced a large devaluation versus the US Dollar, therefore any further strengthening in the US Dollar may not see the full participation of GBP/USD. Instead GBP/USD is favoured to remain stronger then most.
USD/JPY
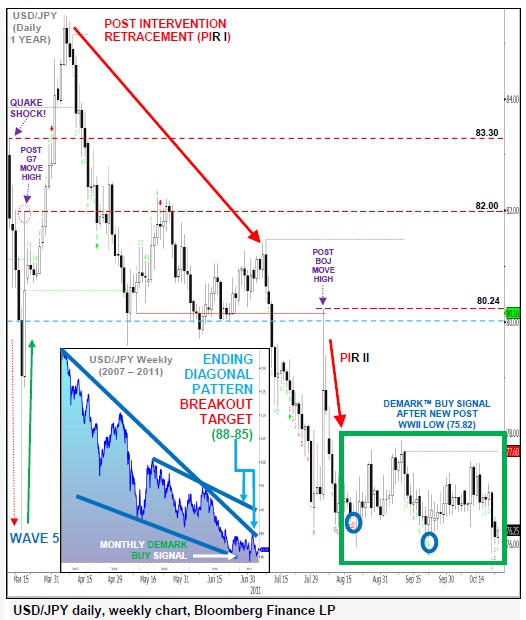
USD/JPY still basing around its NEW all-time low.
USD/JPY maintains a confluence of DeMark™ exhaustion bullish signals, after yet another new post WWII record low which was carved out at 75.82.
These reversal signals are also following the second post intervention retracement in 2011, which is holding around a multi-week base pattern. It is also worth noting that our volatility measures remain very low and continue to favour a major breakout over the short-term horizon.
The medium/long-term view remains bullish, watching for a sustained move above our initial upside trigger level at 77.68. This would offer a resumption of the preferred new structural bull-cycle into the all-important psychological level at 80.00, near 80.24 (post BOJ intervention II high).
Keep in mind that such a scenario would help reactivate the longer-term technical bias, including prior monthly DeMark™ exhaustion signals, within the ending diagonal pattern, which was part of a major Elliott Wave cycle. Only a sustained weekly close below 76.25 will lead to a reassessment of the view and extend temporary weakness into 74.55.
USD/CHF
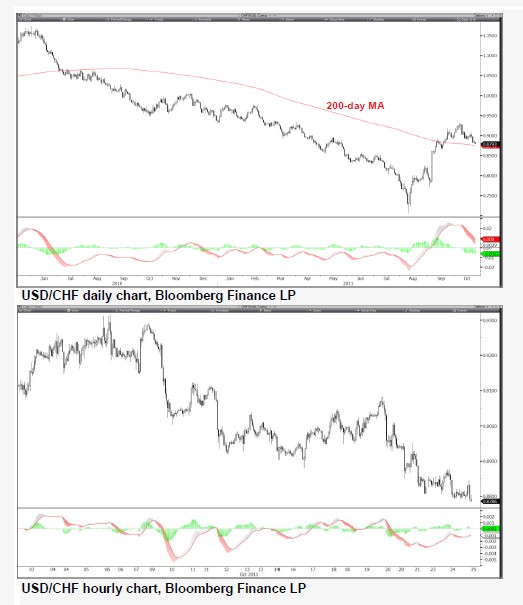
Lower high in place at 0.9083.
USD/CHF appears to have printed a lower high at 0.9083 following the break under 0.8881 yesterday. While under 0.9123 a continuation of this weakness is favoured.
It is also noted that the current trading region is close to the location of the 50 week moving average, at 0.8949. Thus, a continuation of weakness would also warn of a breakdown of the recent recovery structure. However, back under 0.7712 is required to change the long-term bullish bias.
The recent break lower also opens up the potential for a further extension towards 0.8600, where a return to a bullish bias would become attractive again.
Please see the attached chart below.
EUR/USD remains resilient after dipping below 1.05, hinting at a potential breakout. Weak US data and stagflation fears fuel Fed rate cut bets, pressuring the dollar. A break...
USD/CAD lifted by Trump’s tariff push but faces resistance overhead US data missing forecasts at the fastest pace in five months Fed rate cut bets grow, pushing Treasury yields...
The euro has gained ground on Tuesday. In the North American session, EUR/USD is trading at 1.0515, up 0.45%. On Monday, the euro climbed as high as 1.0527, its highest level this...
Are you sure you want to block %USER_NAME%?
By doing so, you and %USER_NAME% will not be able to see any of each other's Investing.com's posts.
%USER_NAME% was successfully added to your Block List
Since you’ve just unblocked this person, you must wait 48 hours before renewing the block.
I feel that this comment is:
Thank You!
Your report has been sent to our moderators for review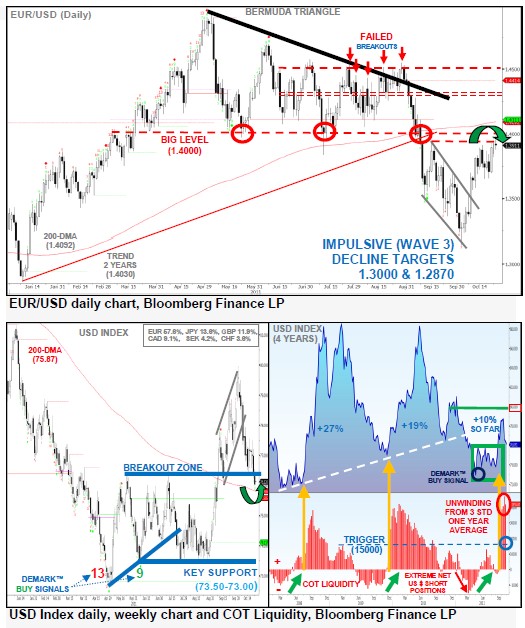

Add a Comment
We encourage you to use comments to engage with other users, share your perspective and ask questions of authors and each other. However, in order to maintain the high level of discourse we’ve all come to value and expect, please keep the following criteria in mind:
Enrich the conversation, don’t trash it.
Stay focused and on track. Only post material that’s relevant to the topic being discussed.
Be respectful. Even negative opinions can be framed positively and diplomatically. Avoid profanity, slander or personal attacks directed at an author or another user. Racism, sexism and other forms of discrimination will not be tolerated.
Perpetrators of spam or abuse will be deleted from the site and prohibited from future registration at Investing.com’s discretion.