- All Instrument Types
- Indices
- Equities
- ETFs
- Funds
- Commodities
- Currencies
- Crypto
- Bonds
- Certificates
Please try another search

Volatility
What Is Volatility?
The volatility of a security is the expected fluctuation of its price at any given time. The expectation is based on the asset's standard deviation from the historical mean.
The range of the price fluctuation determines the risk of holding the asset; a wider price range is more volatile and risky because the future value is less predictable. Volatility is not an indication of market direction necessarily, but it is important when valuing an asset because stability is more valuable.
Risk is one of the most important factors investors consider when making decisions about asset allocation--volatility is the mathematical expression of that risk. Investors, such as older individuals with less time to recover from any sudden losses, and are more concerned about income or stability, look for securities with low volatility. Alternatively, a younger investor who has more time and is interested in allowing their assets to grow more aggressively is more likely to invest in higher volatility assets because they can avoid liquidating security at a loss.
Volatility can also be considered a measurement of opportunity: a wider range of possible prices provides an investor with more chances to acquire an asset when it is cheap and sell it when it is more expensive.
Gauging Market Volatility
A common measure of stock market volatility is the s&p 500 vix index, which illustrates the theoretical expectation of annualized change over the next 30 days for the S&P 500. This index has been nicknamed the “fear index” because values rise when uncertainty increases and drop when uncertainty decreases.
Volatility, as it relates to the overall market, is quantified by the beta coefficient. The value of beta for all possible investments is 1, which is neutral. Therefore, a stock with a beta value of 1.15 is more volatile and risky than a stock with a beta value of 0.88.
Finding Volatility Information on Investing.com
Investing.com offers several volatility tools including beta readings for every stock. On the page for each stock, beta readings appear in the table directly below the chart, in the right-hand column e.g SPY (NYSE:SPY).

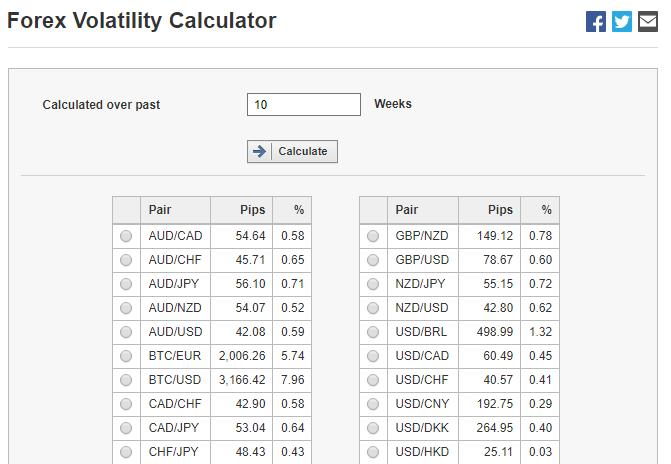
Another available tool is the Volatility Calculator that displays several volatility calculations for currency pairs based on user selections. A link to it can be found by hovering on Tools tab, visible on the black bar at the top of each page.

In addition, Investing.com also offers VIX news and data that is important for all investors to monitor for general volatility expectations.


