
Ashland (NYSE:ASH) Global Holdings Inc. ASH generated profits from continuing operations of $33 million or 55 cents per share in the fourth quarter of fiscal 2021 (ending Sep 30, 2021) against a loss of $14 million or 22 cents in the prior-year quarter.
Barring one-time items, adjusted earnings came in at $1.22 per share. The bottom line increased from the year-ago quarter’s figure of $1.03 but missed the Zacks Consensus Estimate of $1.28 per share.
Sales rose 11.7% year over year to $591 million, but lagged the Zacks Consensus Estimate of $591.2 million.
Sales were driven by strong demand across the company’s core global end markets, higher pricing and contributions from the Schulke& Mayr acquisition. It was partly offset by the exit of low-margin product lines, lower sales of hand-sanitizer additives within personal care and household as well as global supply-chain and logistics disruptions.
Ashland Global Holdings Inc. Price, Consensus and EPS Surprise

Ashland Global Holdings Inc. price-consensus-eps-surprise-chart | Ashland Global Holdings Inc. Quote
Segment Highlights
Life Sciences: Sales in the segment increased 5% year over year to $189 million in the reported quarter. Its operating income also rose 15.4% to $30 million in the quarter.
The upside can be attributed to strong demand within the pharma and nutrition end markets along with higher pricing.
Personal Care and Household: Sales in the division rose 11.6% year over year to $183 million on the back of healthy demand in the core personal care end markets. Operating income increased 85% to $24 million.
Specialty Additives: Sales in the segment increased 13% year over year to $181 million, led by strong demand for architectural coatings additives and favorable pricing. Its operating income also rose to $25 million from $5 million in the prior-year quarter.
Intermediates & Solvents: Sales in the segment increased 114.3% year over year to $60 million, led by higher prices and volumes. Its operating income also rose to $18 million from a loss of $3 million in the prior-year quarter.
FY21 Results
Earnings (as reported) for fiscal 2021 were $2.82 per share compared with a loss of $9.16 per share a year ago. Net sales increased around 4.7% to $2,111 million.
Financials
Cash and cash equivalents dropped around 53.7% year over year to $210 million at the end of the fiscal year. Long-term debt was $1,596 million at the end of the fiscal, up around 2% year over year.
Cash flows provided by operating activities amounted to $151 million in the reported quarter, up from $132 million in the prior-year quarter. Free cash flow was $120 million in the quarter compared with $89 million in the prior-year quarter.
Outlook
Ashland expects sales in the range of $2.25-$2.35 billion for fiscal 2022. It also anticipates adjusted EBITDA between $550 million and $570 million.
The company noted that it projects improving demand across its businesses with no change in its underlying operating performance for fiscal 2022. It expects cost inflation along with supply chain issues. The company also anticipates the execution of its strategy, demonstration of organic growth, improvement in margins and enhanced free cash flow generation in fiscal 2022.
Price Performance
Shares of Ashland have gained 29.6% in the past year compared with a 17.2% rise of the industry.
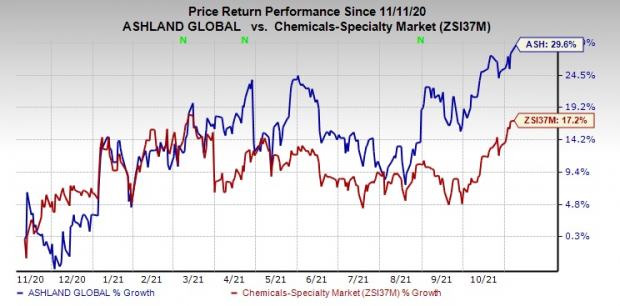 Image Source: Zacks Investment Research
Zacks Rank & Key Picks
Ashland currently carries a Zacks Rank #5 (Strong Sell).
Some better-ranked stocks in the basic materials space are Nucor Corporation (NYSE:NUE) NUE, The Chemours Company (NYSE:CC) CC and Olin (NYSE:OLN) Corporation OLN.
Nucor has a projected earnings growth rate of around 583.5% for the current year. The company’s shares have soared 123.2% in a year. It currently sports a Zacks Rank #1 (Strong Buy). You can see the complete list of today’s Zacks #1 Rank stocks here.
Chemours has an expected earnings growth rate of around 98.5% for the current year. The company’s shares have gained 40.5% in the past year. It currently carries a Zacks Rank #2 (Buy).
Olin has an expected earnings growth rate of around 740% for the current year. The stock has surged 181.2% in the past year. It currently flaunts a Zacks Rank #1.
More Stock News: This Is Bigger than the iPhone!
It could become the mother of all technological revolutions. Apple (NASDAQ:AAPL) sold a mere 1 billion iPhones in 10 years but a new breakthrough is expected to generate more than 77 billion devices by 2025, creating a $1.3 trillion market.
Zacks has just released a Special Report that spotlights this fast-emerging phenomenon and 4 tickers for taking advantage of it. If you don't buy now, you may kick yourself in 2022.
Click here for the 4 trades >>Want the latest recommendations from Zacks Investment Research? Today, you can download 7 Best Stocks for the Next 30 Days. Click to get this free report
Nucor Corporation (NUE): Free Stock Analysis Report
Ashland Global Holdings Inc. (ASH): Free Stock Analysis Report
Olin Corporation (OLN): Free Stock Analysis Report
The Chemours Company (CC): Free Stock Analysis Report
To read this article on Zacks.com click here.
Zacks Investment Research