Auto repair and maintenance service company Driven Brands (NASDAQ:DRVN) stock has been plummeting since peaking nearly a month after its Jan. 15, 2021, initial public offering (IPO). The shares fell lower as pandemic winners tanked in the Nasdaq sell-off, but shares barely recovered during the dead cat bounce. While the name of the Company may not sound familiar, its brands including Meineke, MAACO, CARSTAR, ABRA, Take 5 Oil Change, Uniban, 1-800-Radiator and PH Vitres d’Autos collectively operate over 4,200 centers in the U.S. and 14 international countries. The Company services over 9 million cars annually. As the largest publicly traded automotive services company, the newly minted shares are starting to present opportunistic pullback entries for risk-tolerant investors who subscribe to the belief that a return to normal means a return of more vehicles on the road, which will need servicing.
Q4 FY2020 Earnings Release
On Mar. 10, 2021, Driven Brands released its first public earnings report for its fiscal fourth-quarter 2020 results for the quarter ending December 2020. The Company reported an earnings-per-share (EPS) loss of (-$0.06) versus consensus analyst estimates for a profit of $0.06, a (-$0.12) EPS miss. Revenues rose 58.1% year-over-year (YoY) to $288.8 million, beating analyst estimates for $281.77 million. Full-year 2020 system-wide sales rose 16% YoY to $3.4 billion, with 36% net store growth. Same-store sale (SSS) declined (-3.4%) compared to the 5.4% SSS growth in Q4 2019. The Company added 42 net new stores comprised of 23 stores in the Maintenance segment, 13 stores in the Car Wash segment, and 6 stores in the Paint, Collision, and Glass segment. The revenue increase of 58% YoY was driven by the acquisition of International Car Wash Group in Q3 2021, which added 939 net new stores. The Company ended the quarter with $188.4 million in cash and $155.8 million in undrawn credit revolver. While SSS were positive in the Maintenance and Platform Services segment, the drop came from the Paint, Collision, and Glass segment due to less road traffic resulting in fewer accidents. The lighter road traffic was a result of the pandemic. As the return to normal accelerates, the Company expects positive SSS growth in 2021 with road traffic levels anticipated to rise.
General Full-Year 2021 Guidance
The Company provided a general outlook for 2021 with Adjusted EBITDA as a percentage of revenues to be around 23% with positive SSS growth. Driven Brands expects to add 80 to 90 new stores in the Maintenance segment, 20 to 30 new stores in the Car Wash segment mostly company-operated, and 60 to 70 new stores in the Paint, Collision and Glass segment primarily driven by franchise store growth.
Conference Call Takeaways
Driven Brands CEO, John Fitzpatrick, set the tone, “We added a total of 1,121 locations across our portfolio in 2020, representing net store growth of 36%. And I’m proud we hit the top end of our expected range for fiscal 2020 with revenue of over $904 million, Adjusted EBITDA up $240 million and acquisition Adjusted EBITDA up $269 million.” CEO Fitzpatrick set the narrative:
“Driven Brands is an integrated platform, diversified across multiple brands, geographies, and needs based services, operated primarily by our incredible franchise base. We are the largest automotive services company by store count in this extremely fragmented $300 billion industry.”
He went on to highlight the “numerous levers” to grow SSS including the $90 million marketing fund and data analytics engine, online estimator tools, subscription models, increasing commercial partnerships (additional insurance and fleet agreements) and a digital platform that is constantly refining its direct-to-consumer marketing and improved customer acquisition costs. Since the Car Wash acquisition in August 2020, the Company has integrated over 17 million new customer data elements. The Company can generate the network effect among its differentiated brands accelerated by constantly improving data analytics. The franchise pipeline is strong with over 600 new commitments for 2021. Prudent investors looking to take a position in this asset-light leader in automotive services can monitor for opportunistic pullbacks to scale in.

DRVN Opportunistic Pullback Levels
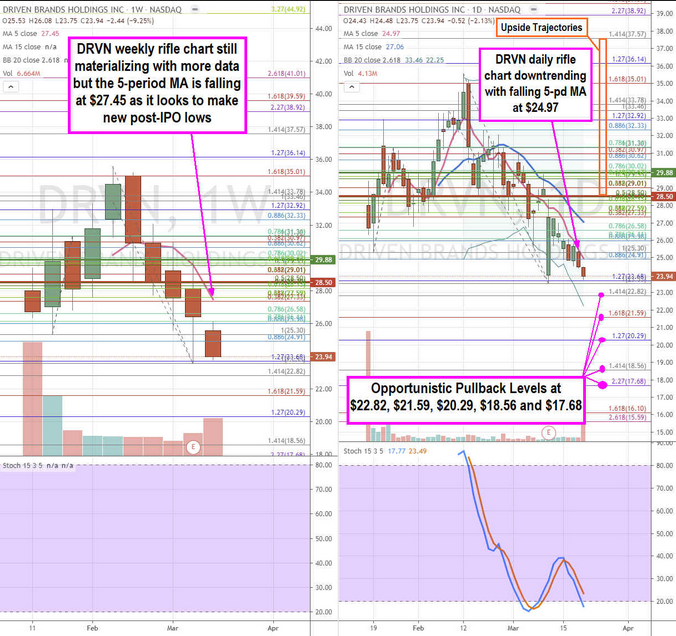
Using the rifle charts on the weekly and daily time frames provides a near-term view of the landscape for DRVN stock. Since this is a recent IPO, the weekly rifle chart is still materializing as more weekly candles develop. However, the weekly rifle chart has formed a 5-period moving average (MA) at $27.45 indicating the downtrend as shares try to defend the $23.68 Fibonacci (fib) level. The weekly stochastic is still developing as is the 15-period MA. The daily rifle chart initially formed a market structure low (MSL) buy trigger above $29.88 triggering a rally to the $35.56 highs before the stochastic peaked and crossed down below the 80-band. This full oscillation sell-off formed the daily inverse pup breakdown that accelerated on the weekly market structure high (MSH) sell trigger under $28.50 collapsing shares to a low of $25.53 before a rebound on the earnings reaction. The bounce was short-lived as shares rejected off the falling daily 5-period MA resistance now at $24.91 with lower Bollinger Bands (BBs) targeting $22.25. The bearish chart presents opportunistic pullback levels at the $22.82 fib, $21.59 fib, $20.29 fib, $18.56 fib, and the $17.68 fib. Keep an eye on automotive repairs and services provider Goodyear Tire & Rubber (NASDAQ:GT). Upside trajectories range from the $28.50 fib up towards the $37.57 fib.
