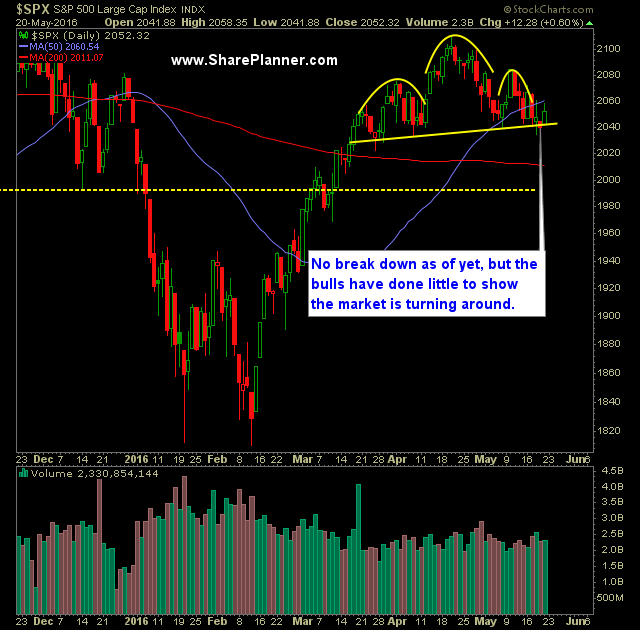
Technical Outlook:
- S&P 500 followed through on Thursdays afternoon rally with a respectable rally on Friday.
- The rally started off strong, but throughout the day, put in a series of lower-highs on the 5-minute chart and never built on the early morning gains.
- SPX still trading below the 50-day moving average, and not trading above the middle band (20-day moving average).
- Volume dropped for a second straight day, but still managed to provide above average volume.
- The key for the bears is, and continues to be, to drop the market below 2039/40 level and close below
- This level represents the neckline of the well-defined and confirmation level of a head and shoulders pattern.
- SPX is trading inside of a well defined channel on the daily off of the April highs. Currently the declining resistance is at 2067.
- SPX 30 minute chart has still not put in place a higher-high, despite putting in place a 33 point rally off of Thursday's lows.
- VIX continues to see sharp breakdowns at the 16.40 level and continues to vacillate on a closing print basis between 13 and 16.40.
- The pullback on the weekly chart of SPX has been very shallow, and could ultimately be a bull flag pattern that it putting in place.
- The massive head and shoulders pattern is still in play for SPX and even confirmed on the Dow Jones Industrial Average.
- The moving averages are all converging on current price action which is a sign of a market that hasn't moved any where in a couple of months.
- The last two times we saw this happen, a massive sell-off ensued (last August and December/January).
- If SPX manages to dip below 2040, the ability for the market to move in much bigger chunks in either direction becomes very possible.
- From 2040 to 2138 - you have a price range that is insanely choppy and continues to be such.
- The 50-week and 100-week moving average have crossed two weeks ago to the downside. Last time this happened was 2001 before the tech correction and again in June 2008 before the mortgage crisis saw its major correction.
- I believe at this point, profits have to be taken aggressively, and avoid the tendency to let the profits run - the market is in a very choppy range that has mired stock price for the past two years. Unless it breaks out of it and onto new all-time highs, then taking profits aggressively is absolutely important.
- Historically the May through October time frame is much weaker than the rest of the year.
My Trades:
- Covered Mastercard Incorporated (NYSE:MA) on Friday at $95.56 for a 0.5% profit.
- Did not add any additional swing-trades to the portfolio.
- Currently 10% Short / 90% Cash
- Remain Short PowerShares QQQ Trust Series 1 (NASDAQ:QQQ) at $105.00
- With one position coming into the week, opting for flexibility to go whatever direction the market chooses to take.

