🔮 Better than the Oracle? Our Fair Value found this +42% bagger 5 months before Buffett bought itRead More

Today's Trading Plan: The Faltering Bounce

Published 05/10/2016, 09:21 AM
Updated 07/09/2023, 06:31 AM
US500
-
SPY
-
MA
-
JNJ
-
XLF
-
VIX
-

Technical Outlook:

  • Yesterday marked an extremely boring an inconsequential day of tradingmarket bounce fail
  • In the final hour of trading, S&P 500 gave up all of its gains on the day and finished nearly flat.
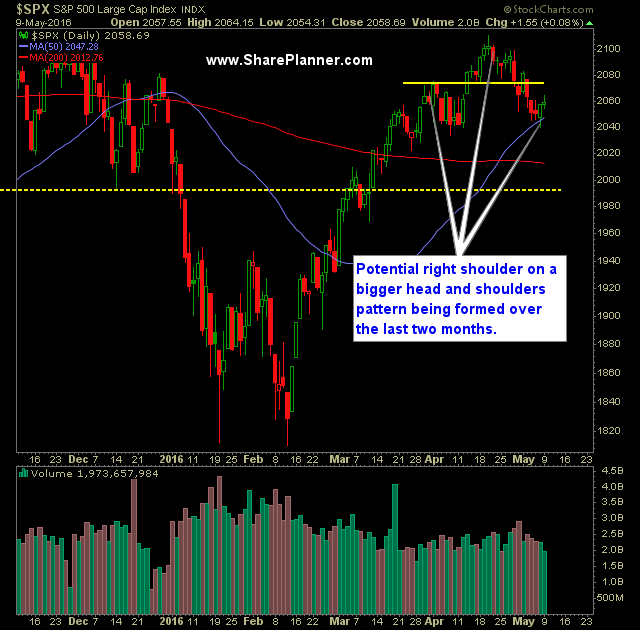
  • The big concern for me on the chart is that there is now a very obvious head and shoulders pattern that is forming on S&P 500 daily over the past two months. Confirming the move would take price down into the 1900's fairly quickly.
  • I believe at this point, profits have to be taken aggressively, and avoid the tendency to let the profits run.
  • 50-day moving average is holding strong, but the doji candle formed on SPX yesterday wasn't entirely convincing of a follow through-like candle.
  • SPY (NYSE:SPY) volume was less than what was seen on Friday and below recent averages.
  • SPX 30 minute chart did manage to put in a higher-high and stop the series of lower-highs.
  • VIX sold off 1% yesterday after being up nicely early on. At this point, it appears more inclined to test the low $13's than it does to test 16.40 again.
  • The number one objective for the bears coming into today is to break price back below last weeks lows of 2039. Do that and you have the head and shoulders pattern.
  • Bulls need to get price back over the highs from yesterday and then reclaim the 20-day moving average again.
  • Historically the May through October time frame is much weaker than the rest of the year.

My Trades:

  • Did not add any new positions yesterday.
  • Covered Mastercard Incorporated (NYSE:MA) at $97.03 for a 0.7% loss.
  • Covered Financial Select Sector SPDR (NYSE:XLF) at 23.11 for a 0.1% oss.
  • Currently 30% Long / 70% Cash
  • Remain Long: Johnson & Johnson (NYSE:JNJ) at $112.65, AAPL at $92.79 and GM at $31.03
  • Will look to add to my long exposure if the market can put together a rally today.

Chart for SPX:

S&P 500 Daily Chart

Original post

Latest comments

Loading next article…
Risk Disclosure: Trading in financial instruments and/or cryptocurrencies involves high risks including the risk of losing some, or all, of your investment amount, and may not be suitable for all investors. Prices of cryptocurrencies are extremely volatile and may be affected by external factors such as financial, regulatory or political events. Trading on margin increases the financial risks.
Before deciding to trade in financial instrument or cryptocurrencies you should be fully informed of the risks and costs associated with trading the financial markets, carefully consider your investment objectives, level of experience, and risk appetite, and seek professional advice where needed.
Fusion Media would like to remind you that the data contained in this website is not necessarily real-time nor accurate. The data and prices on the website are not necessarily provided by any market or exchange, but may be provided by market makers, and so prices may not be accurate and may differ from the actual price at any given market, meaning prices are indicative and not appropriate for trading purposes. Fusion Media and any provider of the data contained in this website will not accept liability for any loss or damage as a result of your trading, or your reliance on the information contained within this website.
It is prohibited to use, store, reproduce, display, modify, transmit or distribute the data contained in this website without the explicit prior written permission of Fusion Media and/or the data provider. All intellectual property rights are reserved by the providers and/or the exchange providing the data contained in this website.
Fusion Media may be compensated by the advertisers that appear on the website, based on your interaction with the advertisements or advertisers.
© 2007-2024 - Fusion Media Limited. All Rights Reserved.