
Lord Abbett Value Opportunities (LVOAX, LVOCX, LVOVX) is a Mid Cap Blend fund investors should avoid. The fund’s poor holdings[1] and high fees diminish the likelihood that the fund will outperform moving forward. The contrast between the fund’s Morningstar rating and its poor holdings lands LVOAX in the Danger Zone this week.
Traditional Research Overrates this Fund
Per Figure 1, LVOVX receives a 4-Star rating from Morningstar while LVOCX and LVOAX receive a 3-Star rating. When viewed through our Predictive Risk/Reward Fund Rating methodology, all four classes earn an Unattractive-or-worse rating, with LVOAX earning a Very Unattractive rating.
Figure 1: Lord Abbett Value Opportunities Fund Ratings

Sources: New Constructs, LLC and company filings
Holdings Quality Research Reveals Flaws
The only justification for a mutual fund to charge higher fees than its ETF benchmark is “active” management that leads to out-performance. A fund is most likely to outperform if it has higher quality holdings than its benchmark. To make this determination on holdings quality, we leverage our Robo-Analyst technology[2] to drill down and analyze the individual stocks in every fund we cover.
Figure 2: Lord Abbett Value Opportunities Asset Allocation vs. Benchmark

Sources: New Constructs, LLC and company filings
Per Figure 2, Lord Abbett Value Opportunities Fund’s asset allocation poses greater downside risk than its benchmark, iShares Russell Mid-Cap (NYSE:IWR). LVOAX allocates only 7% of its portfolio to Attractive-or-better rated stocks compared to 18% for IWR. Exposure to Unattractive-or-worse rated stocks is much higher for LVOAX (48% of portfolio) than for IWR (37% of portfolio).
Six of the mutual fund’s top 10 holdings receive an Unattractive-or-worse rating and make up 12% of its portfolio. In total, all of the top 10 holdings receive a Neutral-or-worse rating and make up 20% of LVOAX’s portfolio.
Given the unfavorable distribution of Attractive vs. Very Unattractive allocations relative to the benchmark, Lord Abbett Value Opportunities appears poorly positioned to generate the outperformance required to justify its fees.
Not Seeing Much “Value” In This Value Fund
Figure 3 contains our detailed rating for LVOAX, which includes each of the criteria we use to rate all funds under coverage and shows the fund’s poor portfolio management. These criteria are the same for our Stock Rating Methodology, because the performance of a fund’s holdings equals the performance of a fund after fees.
Figure 3: Lord Abbett Value Opportunities Fund (LVOAX) Rating Breakdown
 Rating Breakdown")
Sources: New Constructs, LLC and company filings
As Figure 3 shows, LVOAX’s holdings are worse than IWR and SPY in all five of the criteria that make up our holdings analysis. Specifically:
- LVOAX’s holdings earn a Neutral economic earnings GAAP earnings rating while IWR and SPY earn an Attractive rating.
- The return on invested capital (ROIC) for LVOAX’s holdings is 9%, which is below the 10% earned by companies held by IWR and half the 18% earned by SPY holdings.
- The -3% free cash flow yield of LVOAX’s holdings is less than the 1% earned by IWR stocks and the 2% earned by SPY stocks.
- The price-to-economic book value (PEBV) ratio for LVOAX is 3.5 compared to 3.1 for IWR and 3.2 for SPY.
- Our discounted cash flow analysis reveals an average market-implied growth appreciation period (GAP) of 40 years for LVOAX holdings compared to 35 years for IWR and 32 years for SPY.
This analysis reveals that, ultimately, the companies held by LVOAX earn inferior cash flows (as measured by economic earnings and ROIC) but are valued at a premium (as measured by FCF yield, PEBV, and GAP) when compared to the benchmark.
FLIR Systems (NASDAQ:FLIR) is one of LVOAX’s top holdings and earns an Unattractive rating. Since 2010, FLIR’s after-tax profit (NOPAT) fell 2% compounded annually. Over the same time, its ROIC fell from 22% to 10% TTM and its NOPAT margin declined from 19% in 2010 to 12% TTM. Despite the deterioration in fundamentals, shares remain significantly overvalued.
To justify its current price of $55/share, FLIR must achieve 14% margins (vs 12% TTM) and grow NOPAT by 10% compounded annually for the next 10 years. See the math behind this dynamic DCF scenario here. This scenario seems unlikely given FLIR’s declining margins and inability to grow NOPAT since 2010.
Even if we assume FLIR can achieve a 14% NOPAT margin and grow NOPAT by 5% compounded annually for the next decade, the stock is worth only $38/share today – a 31% downside. See the math behind this dynamic DCF scenario here.
Excessive Fees Make the Fund Even More Risky
At 3.79%, LVOAX’s total annual costs (TAC) are higher than 95% of the 408 Mid Cap Blend style funds under coverage. For comparison, the average TAC of all Mid Cap Blend mutual funds under coverage is 1.82%, the weighted average is 1.31%, and the benchmark ETF (IWR) has total annual costs of 0.20%.
Per Figure 4, Lord Abbett Value Opportunities Fund’s expense ratios understate the true costs of investing in this fund. Our TAC metric accounts for more than just expense ratios. We take into account the impact of front-end loads, back-end loads, redemption fees, and transaction costs.
Figure 4: Lord Abbett Value Opportunities Fund’s Real Costs

Sources: New Constructs, LLC and company filings
To justify its higher fees, each class of the fund must outperform its benchmark by the following over three years:
- LVOAX must outperform by an average of 3.56% annually.
- LVOCX must outperform by an average of 2.19% annually.
- LVOVX must outperform by an average of 0.94% annually.
An in-depth analysis of LVOAX’s TAC is on page 2 here.
Underperformance Looks Likely to Continue
Over the past one, three, five, and ten-year periods, LVOAX has not surpassed the 3.56% per year outperformance required to justify its higher fees. Per Figure 5, LVOAX, LVOCX, and LVOVX has underperformed (measured by growth of $10K) its benchmark over the past five years.
Figure 5: Lord Abbett Value Opportunities vs. IWR: Growth of 10K
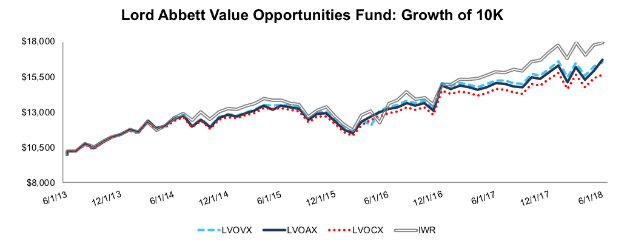
Sources: New Constructs, LLC and company filings.
Given that 48% of assets are allocated to stocks with Unattractive-or-worse ratings, LVOAX looks likely to underperform moving forward.
The Importance of Holdings Based Fund Analysis
The analysis above shows that while the Mid Cap Blend style receives a Neutral rating in our 2Q18 Style Ratings for ETFs & Mutual Funds report, it still contains risky funds. With so many ETFs and mutual funds in the style (428), picking the right one can be difficult. Smart fund investing means analyzing the holdings of each fund, which is impossible for the average investor to perform.
Our machine learning and Robo-Analyst technology helps investors navigate this investment style by sifting through the holdings of all 428 Mid Cap Blend ETFs and mutual funds. This diligence allows us to identify potentially dangerous funds that traditional backward-looking fund research may overlook.
Each quarter we rank the 11 sectors in our Sector Ratings for ETF & Mutual Funds and the 12 investment styles in our Style Ratings For ETFs & Mutual Funds report. This analysis allows us to find funds that investors using traditional fund research may view as quality investments while deeper analysis reveals otherwise, such as Lord Abbett Value Opportunities Fund. Rather than putting money into LVOAX, investors would be better suited with one of the 61 Attractive-or-better rated ETFs and mutual funds in the Mid Cap Blend style.
Disclosure: David Trainer, Kyle Guske II, and Sam McBride receive no compensation to write about any specific stock, sector, style, or theme.