Summary: 2Q financials have been poor, with negative growth in both sales and EPS. Sales growth has been affected by a 50% fall in oil prices and 15% fall in the value of trading partner currencies. Both of those are likely to make upcoming 3Q financials look bad as well.
Of note is that profit margins are still expanding for most sectors.
Looking ahead, perhaps the biggest wildcard is the US dollar, which historically weakens after interest rates start rising. This would be a boon to the roughly 40% of S&P sales and profits that are derived from overseas.
Especially for their rate of growth, S&P valuations are high. Even if sales and EPS growth start to pick up, valuations are likely to remain a considerable headwind to equity appreciation.
About 87% of US corporates have reported their financial results for the 2nd quarter of 2015. What have we learned?
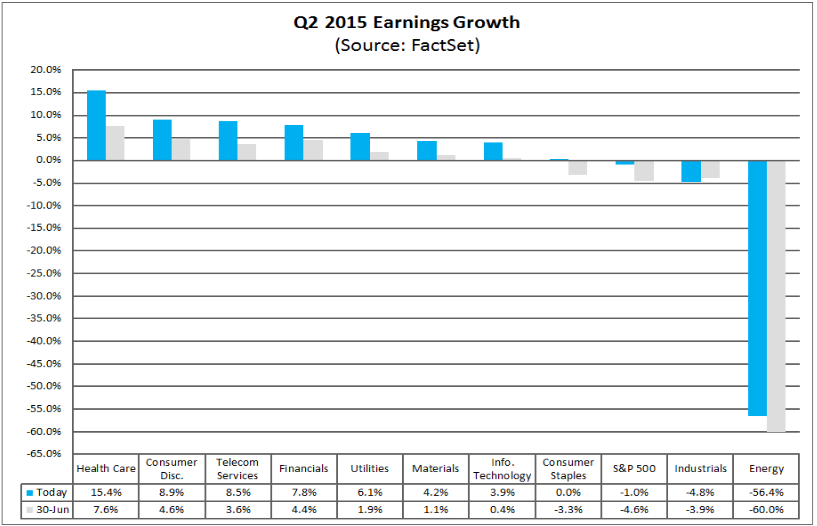
Using figures from FactSet, EPS growth in 2Q is tracking minus 1.0% (year over year) versus an expected growth rate of minus 1.9% on March 31st when the quarter began; sales growth is tracking minus 3.3%, exactly as expected when the quarter began.
Although EPS turned out to be better than expected while sales met expectations, neither result is impressive as both are down from last year.
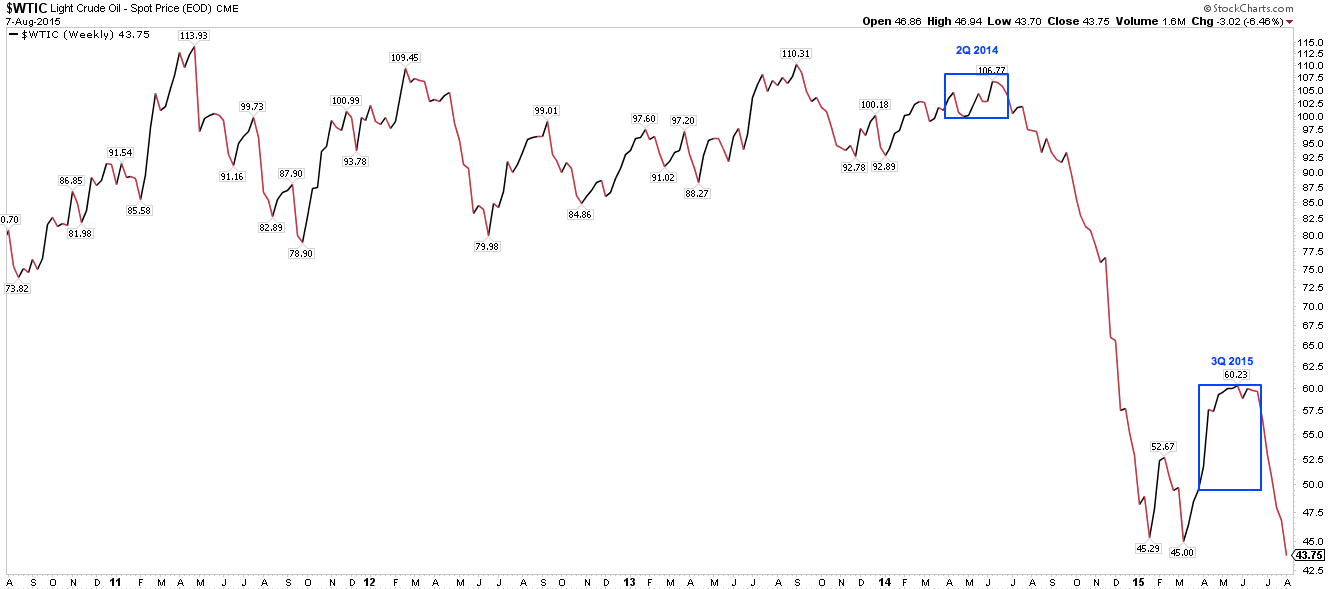
By now it should be no surprise that the energy sector has been hard hit by falling oil prices. The average price of oil was over $100 in the 2Q of 2014; it fell 50% to an average of roughly $55 in 2Q of 2015.
As a result, EPS for the energy sector fell by 56% and sales fell by 32%, almost the exact same declines seen in 1Q.
There are 10 sectors in the S&P 500; 8 of the 10 saw a rise in EPS over last year. The energy sector is clearly an outlier, driven by the rapid fall in the price of a single commodity. The only other sector where profits were lower was industrials (data from FactSet).
It's useful, therefore, to consider what happens to the S&P's sales and EPS growth once the year over year decline in oil prices becomes negligible. After all, the price of oil today is essentially the same as when the year started. Excluding the energy sector, 2Q15 EPS growth for the remaining 90% of the S&P rises to a respectable 5.7%. Sales growth rises to a paltry 1.6%.
(Side note: the point of excluding energy is not to imply that it is unimportant or that actual S&P results are better than they are. Think of this as being like core-CPI: excluding energy gives a more reliable view of the underlying trend in inflation. This is why we are excluding energy companies' financial results: to see whether the underlying trend has changed for the rest of the S&P).
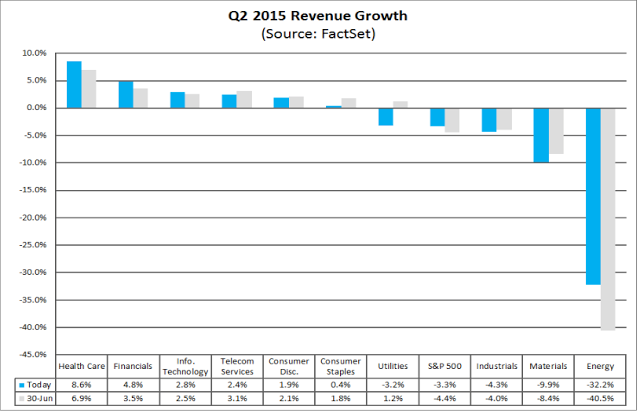
The 1.6% sales growth in 2Q, excluding energy, is a significant drop from the trend: throughout 2014, the trailing 12-month average sales growth was about 4%.
In fact, although energy was the largest drag on 2Q sales growth, other sectors (utilities, industrials and materials) also declined. Staples are barely growing and discretionary spending is up just 1.9% in the past year. Healthcare was an outlier, growing sales at nearly 9%.
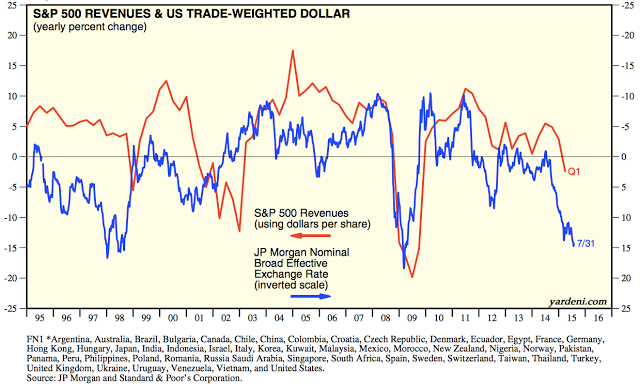
So, the drop in corporate growth was not just about lower oil prices. The largest factor affecting the rest of the S&P is the rise in the dollar; the lower value of trading partner currencies lowered revenues earned overseas. In the past year, the value of trading partner currencies has fallen by 15% (blue line). That has had a predictably negative affect on revenues (red line; data from Yardeni).
Earnings growth of 5.7%, excluding energy, is also below trend: throughout 2014, the trailing 12-month average was about 8%.
When EPS growth exceeds sales growth, it means that profit margins are continuing to expand. In fact, that is the case: average profit margins were 10.4% in the most recent quarter, a rise from 10.1% a year ago.
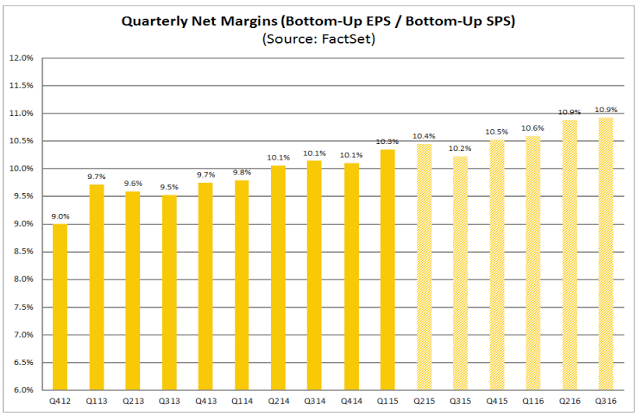
Those margins would have risen more if not for energy. Energy margins have collapsed from over 8% a year ago to less than zero. Most of the other large weighted sectors experienced an expansion in margins (data from S&P).

The margins for the energy sector will remain low or negative in 3Q of 2015: the average price of oil a year earlier was about $95 versus $43 today. Reflecting this, FactSet expects average margins, including energy, to fall to 10.2% in 3Q from 10.4% in 2Q.
If oil prices can rise to an average of $60-70 during 4Q, the year over year impact of falling energy profit margins on total S&P EPS will become negligible, as $70 was the average oil price in 4Q of 2014. Profit margins could therefore expand, other things being equal.
Sales growth will continue to be weak. The year over year changes in the dollar are still unfavorable for the roughly 40% of the S&P that derives sales from overseas.
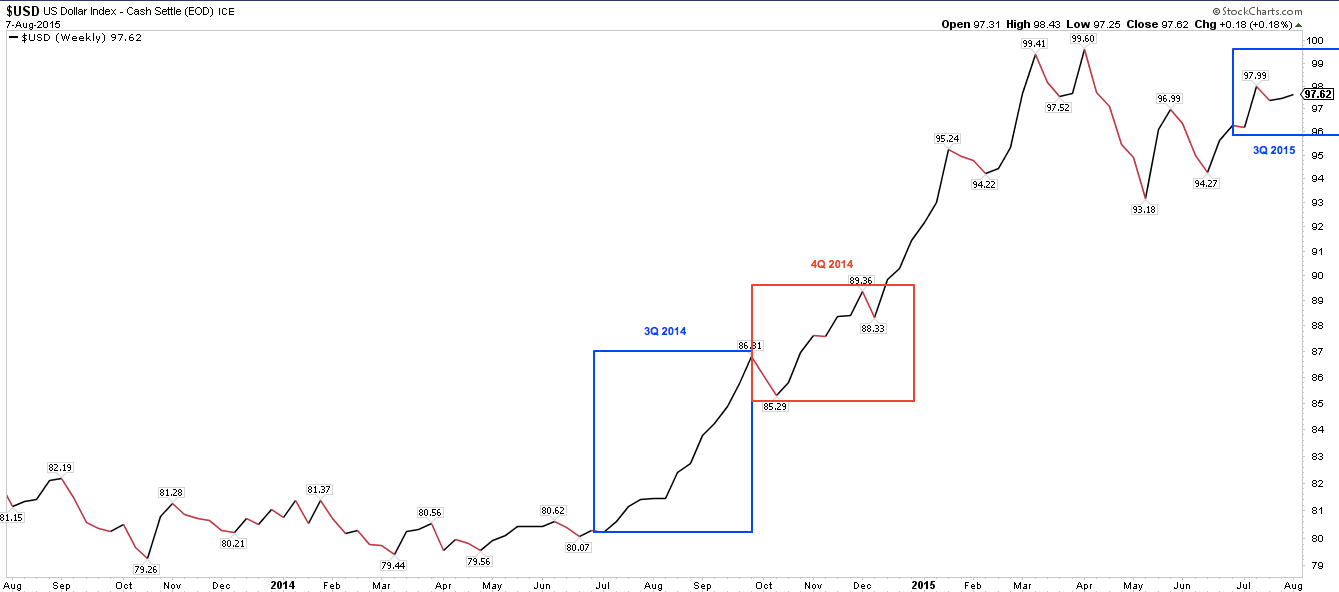
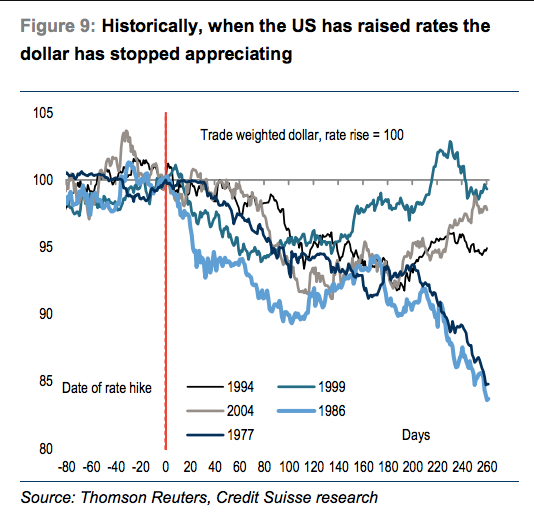
The relationship between currencies and relative interest rates and relative growth is complex. But it's noteworthy that the Fed is considering raising rates in September and that, historically, the first rate increase has been met with a fall in the dollar. Whether that happens this time, or even whether the Fed raises rates, is unclear. But an end to the appreciation of the dollar would likely return sales growth to trend (data from Credit Suisse).
Today, the consensus expects total S&P EPS for the full year 2015 to grow 1.2%. A year ago, the consensus had expected more than 10% growth in EPS this year, so expectations have fallen hard. Of note is that actual EPS has been better than expected at the start of each quarter: assuming the consensus will be too high for the full year may well prove wrong. Still, 1.2% EPS growth for the full year is poor.
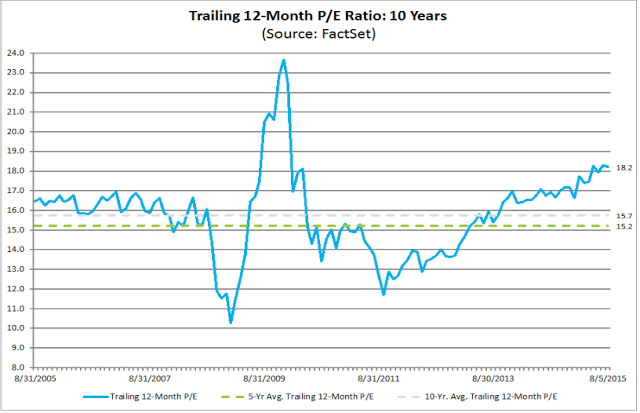
In the meantime, reflecting low and uncertain growth, the S&P index is marking time. Year to date, the index has gained just 1%. The trailing 12-month P/E ratio is 18x, which is high relative to the past 10 years (the pop in P/E in 2009 is due to EPS falling). Even if sales and EPS growth start to pick up, valuations are likely to remain a considerable headwind to equity appreciation.
