As trend-watching goes, there was only one way to cast your gaze Wednesday: down.
The selling wave left almost no place to hide in risk assets. The catalyst, at least, is no mystery, or so it appears: higher inflation.
Yesterday's consumer price index was hotter than expected in April. The monthly and year-over-year numbers came in well above expectations, which were already hot relative to March. The annual pace of headline CPI, for instance, surged to 4.2%, the highest since 2008.
The great debate has formally started over whether this is temporary (due to so-called base effects) or something more ominous with a longer-term path. Mr. Market, for now, is erring towards the latter and so is inclined to take cover.
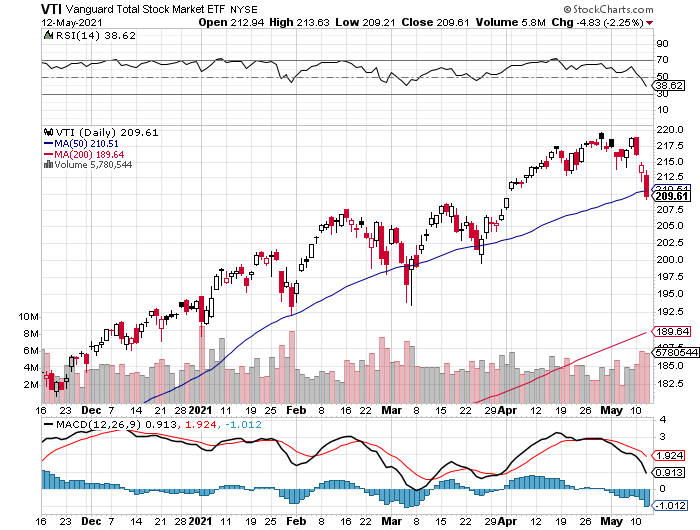
US stocks certainly took a drubbing: Vanguard Total Stock Market Index Fund ETF Shares (NYSE:VTI) fell 2.3% yesterday, pulling the fund below its 50-day moving average for the first time since Mar. 25.
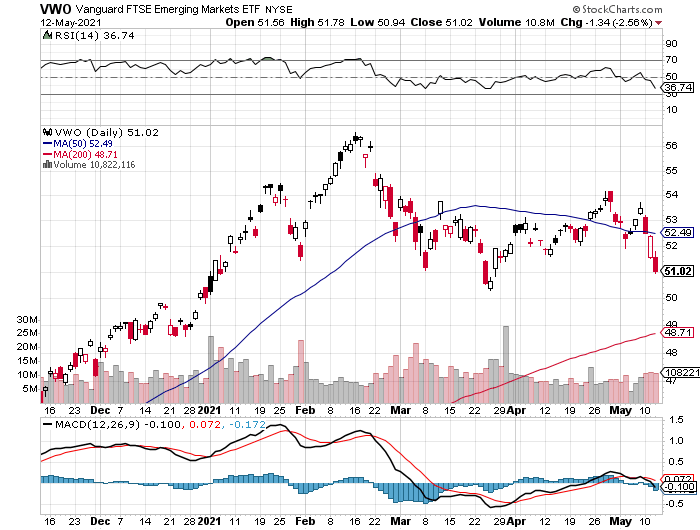
Emerging markets stocks looked even worse. Vanguard FTSE Emerging Markets Index Fund ETF Shares (NYSE:VWO) was already shaky in 2021. Wednesday's sell-everything mentality wasn’t helping.
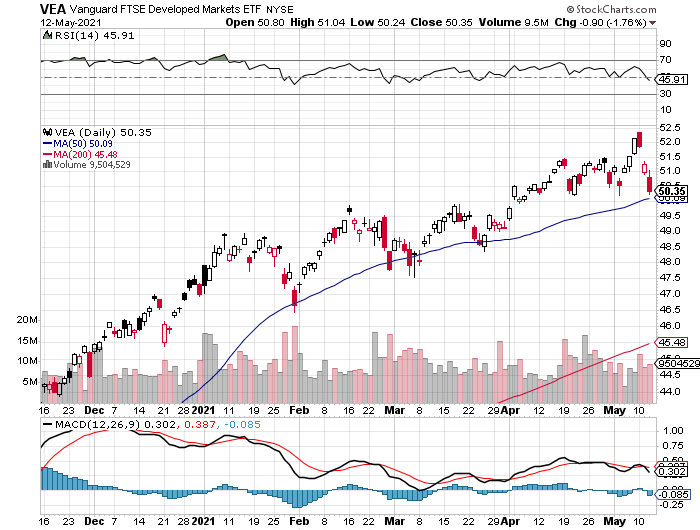
Vanguard FTSE Developed Markets Index Fund ETF Shares (NYSE:VEA) took a hit too, but compared with US and emerging markets this slice of global equities fared relatively well.
Whether the upside technical edge holds is unclear, but for now there’s still a bullish bias in the trend. Maybe that’s because a big slice of VEA (50%-plus) is allocated to Europe, where disinflation and deflation still have the upper hand and so the Continent may be relatively immune from blowback from reflation or worse.
Finding a safe-haven, however, was tough yesterday. The usual go-to safe-room—bonds—was anything but.
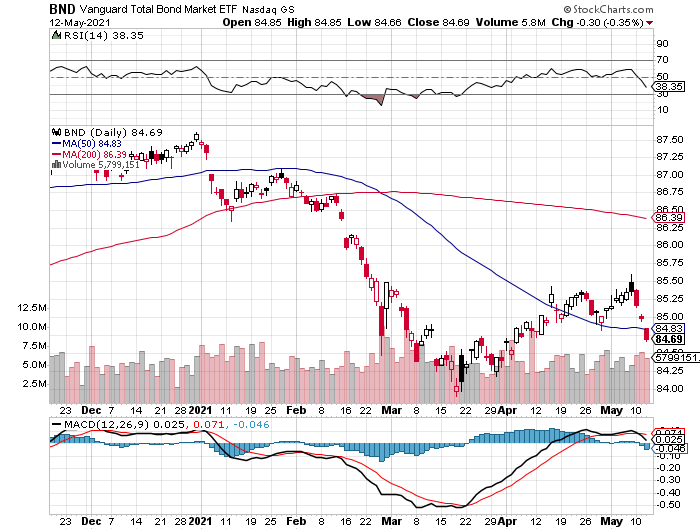
Vanguard Total Bond Market Index Fund ETF Shares (NASDAQ:BND) tumbled for a third day. The cumulative selling this week has reversed much of the repair and recovery that’s been bubbling for the past two months.
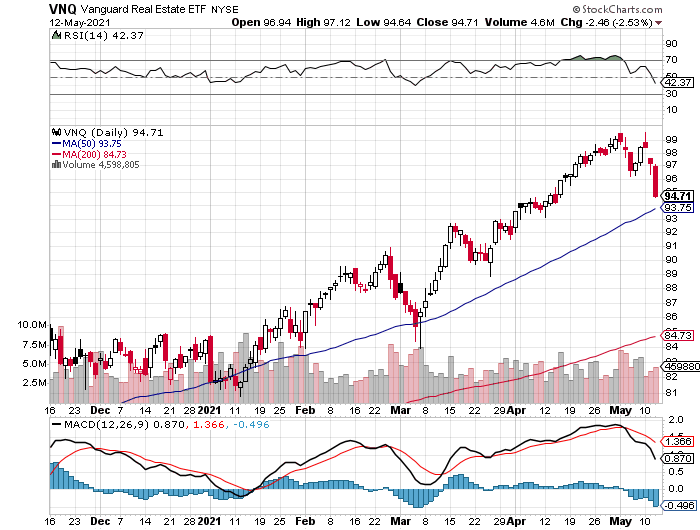
US real estate investment trusts were no help in Wednesday's rout. Vanguard Real Estate Index Fund ETF Shares (NYSE:VNQ) took a heavy blow in yesterday's trading, suffering a 2.5% haircut.
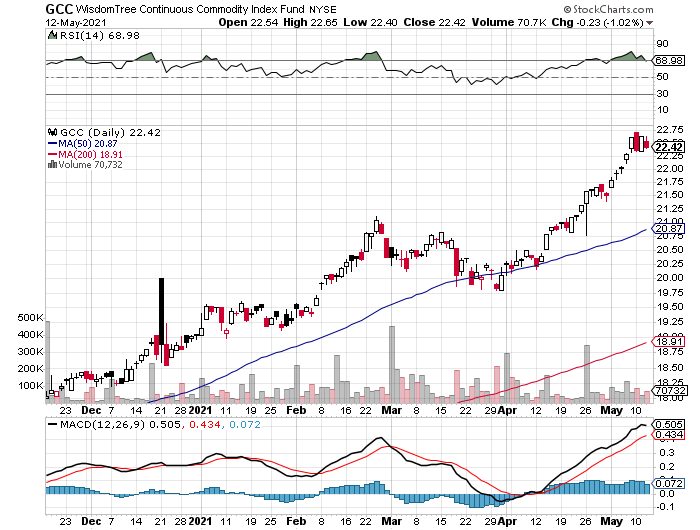
Commodities held up relatively well, as you would expect when everyone’s rushing for the exits on the assumption that the inflation monster is coming. But “pretty well” was still painted with a shade of red: WisdomTree Continuous Commodity Index Fund (NYSE:GCC)— an equally mix of commodities—dropped 1.0%.
The fund’s technical profile, however, still looked encouraging.
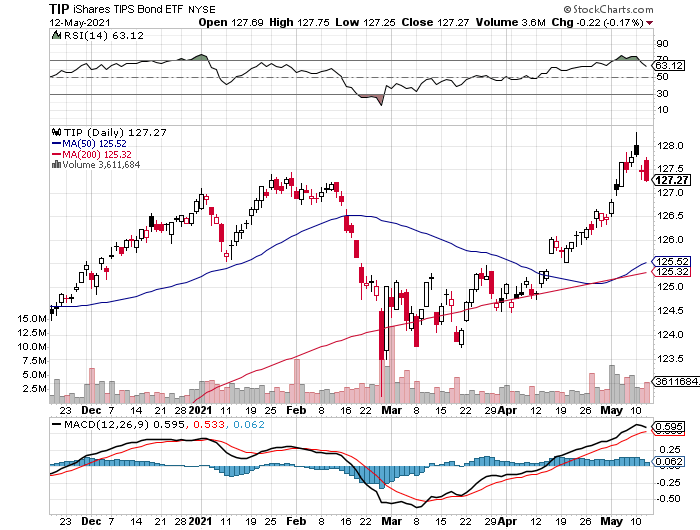
If you thought inflation-protected Treasuries would be spared during inflation-triggered selloff, think again. After rallying earlier in the day, iShares TIPS Bond ETF (NYSE:TIP) reversed course and ended with a 0.2% loss.
But let’s be fair, that looked a lot better than bonds generally. Although much of the TIPS yield curve was still negative, the reasoning in some corners is that negative real yields will be offset by higher inflation, and then some for TIPS, which adjust nominal payouts based on CPI.
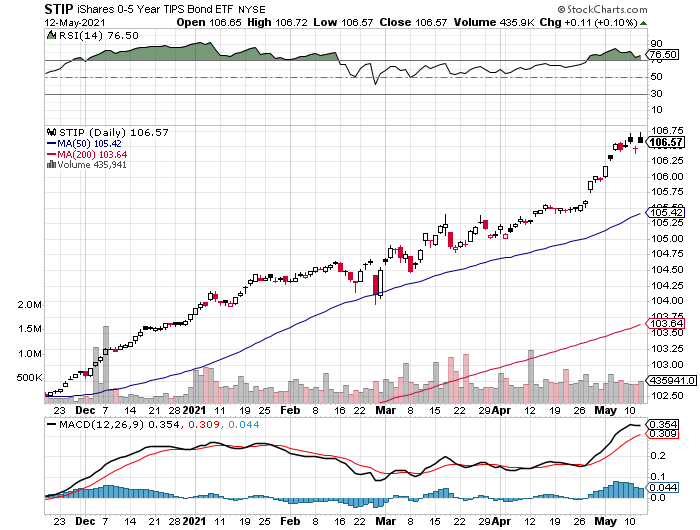
In fact, shorter-term TIPS appear to be the star performer yesterday. The iShares 0-5 Year TIPS Bond ETF (NYSE:STIP) ticked up 0.1%, holding near a record high. Are we looking at the new market darling for the road ahead?

