
Technically Speaking For The Week Of May 20-24
Summary
- International data is still weaker; Japan and the EU are still in a soft patch
- US data was mostly good
- The combination of weaker small-caps and an inverting yield curve could be signaling a recession
International Economic Releases of Note
China/Japan/Australia
Japan
- 1Q GDP up 2.1% annual rate
- Industrial Production down 4.3% Y/Y
- Exports down 2.4% Y/Y
- Markit PMI 49.6
Australia
- Westpac leading index down 0.47%
- Australian PMI 52.2
- Construction spending down 2.4%
China/Australia Conclusion: Japan is a bit weaker than the data implies. The "strength" in the latest GDP report was caused by two one-off numbers contained in the report. Continued weakness in exports and the Markit data point to more weakness. Australia is in fairly decent shape, however.
EU/UK/Canada
EU
- March EU current account at 25 billion euros
- EU consumer confidence up 0.8%
- Manufacturing PMI 49
- Services PMI 52.2
- Overall PMI 51.6
UK
- UK inflation at 2% Y/Y
Canada
- Retail sales up 1.1%
EU/UK/Canada conclusion: The EU is still weak, with the data being just this side of positive. The PMI report continues to indicate weak export orders. The UK's main problem is political; now that Teresa May has resigned, the country has increased political risk at a time when that is the last thing they need.
Central Bank Actions of Note
None for this week.
US Economic Releases of Note
This week, we received the latest housing market statistics, starting with new home sales (emphasis added):
Sales of new single‐family houses in April 2019 were at a seasonally adjusted annual rate of 673,000, according to estimates released jointly today by the U.S. Census Bureau and the Department of Housing and Urban Development. This is 6.9 percent (±14.0 percent)* below the revised March rate of 723,000, but is 7.0 percent (±12.4 percent)* above the April 2018 estimate of 629,000.
While large, one-month drops can be concerning at first, this is occurring after three months of strong increases:
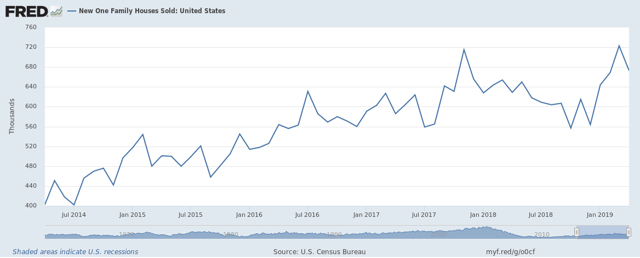
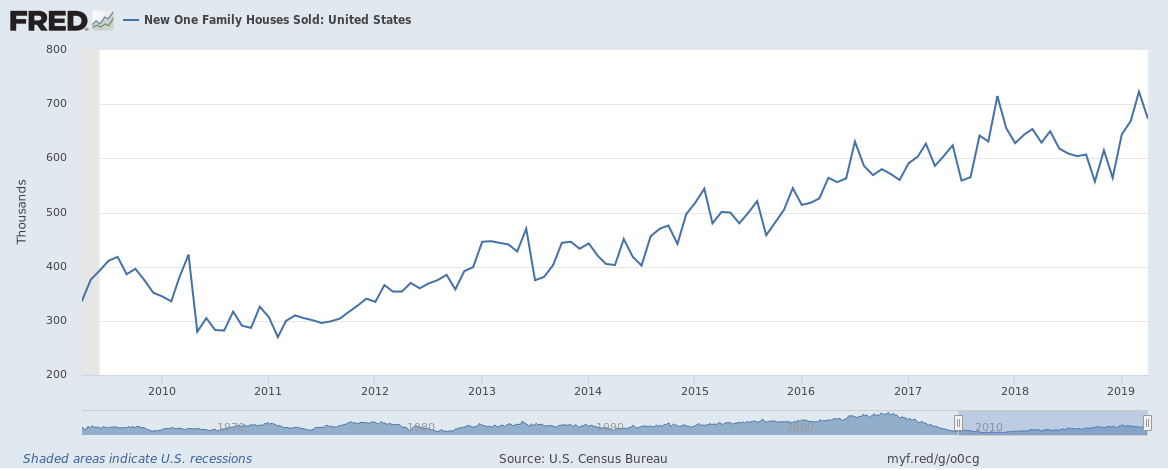
Moreover, new home sales are still near their highs for this cycle:
Existing home sales - which are responsible for the vast majority of housing transactions - were 0.6% lower on the month, thanks to a large drop (-4.5%) in NE home sales. This data series has trended lower over the last year and a half:
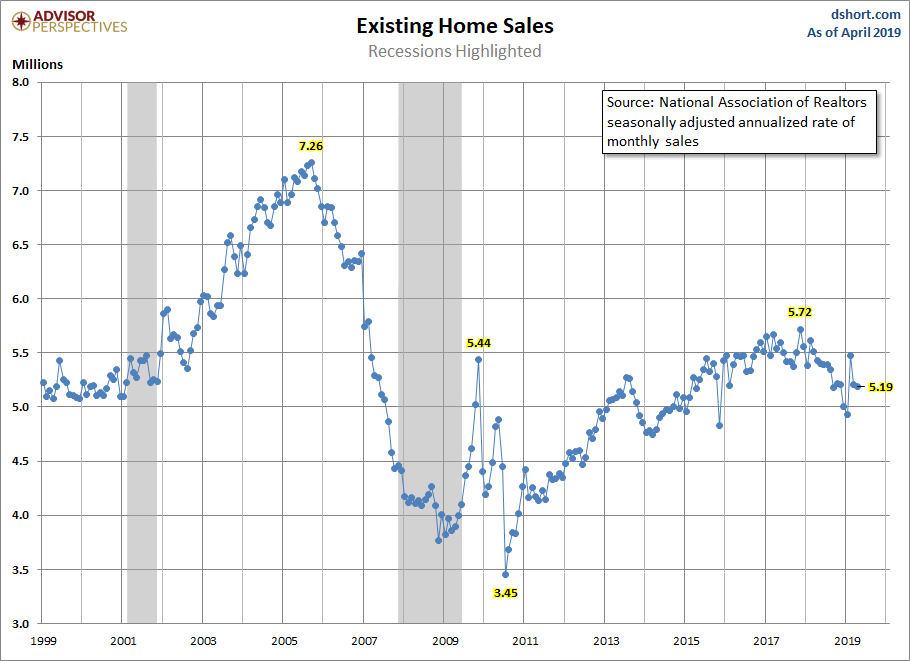
The decline is less a collapse and more a softening caused by higher interest rates. The 15 and 30-year mortgage rate dropped sharply since the beginning of the year, which should help to either stabilize demand at current levels or provide a modest uplift to activity.
On Friday, the Census reported that durable goods orders declined (emphasis added):
New orders for manufactured durable goods in April decreased $5.4 billion or 2.1 percent to $248.4 billion, the U.S. Census Bureau announced today. This decrease, down two of the last three months, followed a 1.7 percent March increase. Excluding transportation, new orders were virtually unchanged. Excluding defense, new orders decreased 2.5 percent. Transportation equipment, also down two of the last three months, drove the decrease, $5.4 billion or 5.9 percent to $85.4 billion.
For our purposes, there are two key numbers in this report: manufacturers new orders for nondefense capital goods and new orders for consumer durable goods:

Left charts are total value; right charts are Y/Y
Nondefense capital goods orders were off modestly. That series has moved sideways for the last year; its Y/Y number is now trending near 0% growth. New orders for consumer durable goods were up modestly; Y/Y numbers are still strong.
US Conclusion: The decline in new home sales is probably a "cooling off" month after a period of increased activity. While existing homes sales are softer, there is no indication the market is collapsing. The durable goods numbers were mixed, but, like the existing home sales numbers, could easily be described as softer.
Turning to the markets, today I want to engage in a thought experiment to answer this question: are the markets signaling an upcoming recession?
Let's start here with the yield curve:
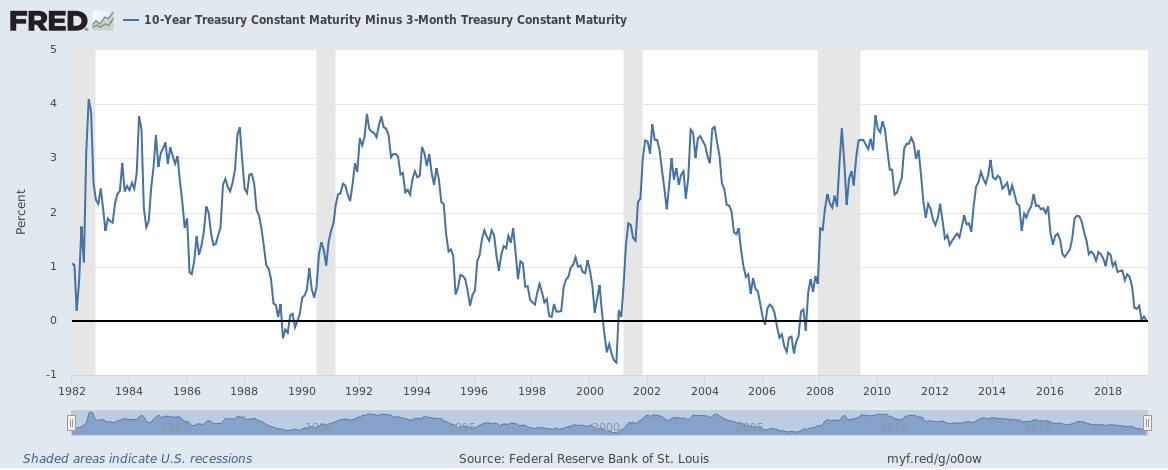
The 10-Year/3-Month yield curve has inverted before the last three recessions - and most of the others since WWII. Here's why: a few years before a recession starts, the Fed begins raising rates, ostensibly to prevent inflation from spreading (during this expansion, the underlying reason is to return to a more "normal" interest rate level). Then about 12-18 months before a recession, the long-end of the curve starts to rally as bond traders reason that growth will slow, which means lower inflation. These two actions work to compress the yield curve from both ends.
We also know that the equity markets are a leading indicator; traders usually buy stocks at the bottom of a recession in anticipation of growth and then sell them before the recession starts to lock-in profits. That being said, consider these 7-year charts of three smaller-cap indexes:

Micro-caps hit a high of 109.39 last summer. They sold off with the market last fall and participated in some of the relief rally. But this index has traded sideways for most of this spring, contained in a fairly tight trading range.

Small-caps have the exact same pattern, except their spring trading range is a bit wider and more volatile. Still, they have been unable to ascend to new highs this year.
The IJH has the same problem - it remains below last year's higher level.
To sum up this data, the smaller the size of the company in the index, the further it is from its respective last year's high and the more contained it is in a trading range. This is not happening with the QQQ and SPY - but those indexes are comprised of larger, more mature companies that are more likely to survive a weaker economy; they're also more likely to pay a dividend and be engaging in buybacks, which are more likely to support the stock price.
The combination of the inverting yield curve and weaker smaller-cap indexes may be trying to tell us something. I'm not saying it is, only that maybe we should at least listen and think about the possibility.
Disclosure: I/we have no positions in any stocks mentioned, and no plans to initiate any positions within the next 72 hours. I wrote this article myself, and it expresses my own opinions. I am not receiving compensation for it (other than from Seeking Alpha). I have no business relationship with any company whose stock is mentioned in this article.