
The greenback continued to tumble, while equities continued to recover, even after the U.S. initial jobless claims for last week hit a record of 3.283mn. This may have been due to the fact that claims were still below the upper end of the forecasts’ range, which was at 4mn, or it could be due to increasing expectations that further stimulus may be in the works.
INITIAL JOBLESS CLAIMS SURGE TO 3.3MN BUT EQUITIES CONTINUE TO GAIN
The dollar continued sliding against the other G10 currencies on Thursday and during the Asian morning Friday. It lost the most ground versus GBP, NOK and AUD in that order, while it lost the least ground against EUR, CHF and CAD.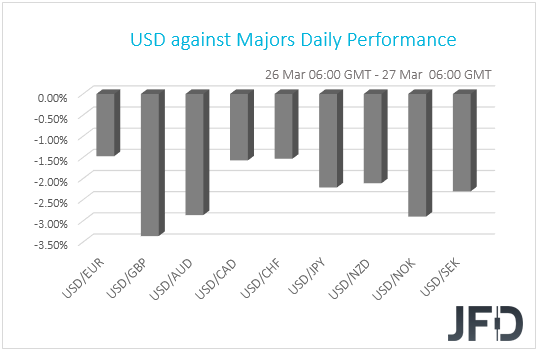
The fact that the dollar kept weakening suggests that investors may have continued increasing their risk exposure for a third straight day. Indeed, major EU and US indices were a sea of green, with the positive investor morale rolling into the Asian session today. Both Japan’s Nikkei 225 and China’s Shanghai Composite gained 3.88% and 0.26% respectively.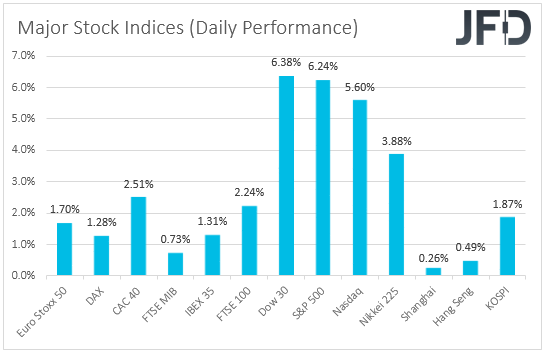
Yesterday, the main event on the agenda was the US initial jobless claims for last week. The forecast was for a surge to 1mn new people signing for unemployment benefits, due to companies announcing layoffs and state lockdowns forcing stores to close. However, the actual number was much higher, hitting a record of 3.283mn.
Strangely, at least to us, equities continued to surge, with the S&P 500 completing an around 15% recovery sine Monday, and Dow Jones exiting bearish-market territories after completing a 21% recovery this week. This may have been due to the fact that claims were still below the upper end of the forecasts’ range, which was at 4mn, or it could be due to increasing expectations that further stimulus may be in the works.
After all, the bad print came after the Senate approved a USD 2 trillion fiscal stimulus package, which is widely anticipated to pass through the House of Representatives later today, and after Fed Chair Powell said in a televised interview that the Fed is not going to run out of ammunition and that they still have policy room for more action. With the Committee already cutting rates to the 0-0.25% range, and announcing unlimited amounts of QE purchases, this raises the question: Will they go for negative rates? The Fed has never been in favor of the “negative rates regime”, but it remains to be seen whether the economic damage caused by the coronavirus will force them to make an exception. At least, according to the yields of the Fed funds futures, investors do not expect something like this at the moment.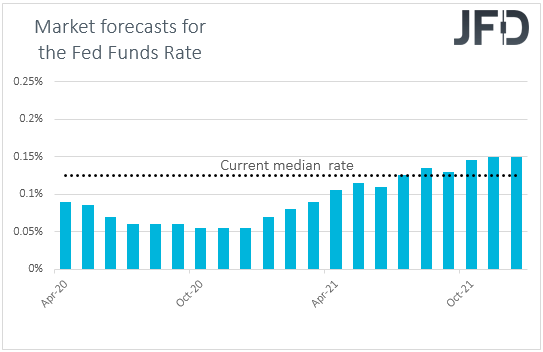
As for our view, despite the latest rally in risk appetite, it has not changed. Even if equities continue to gain for a while more, we find it difficult to trust a long-lasting recovery. New infected cases and deaths hit another record yesterday, which suggests that the virus continues to spread at an exponential pace and that we have not reached a peak yet. Thus, the economic damages could deepen and the wounds could drag much more than investors currently anticipate. We would treat the recent risk-on rally, or any extensions of it, as a strong corrective bounce at the moment. We still see decent chances for risk-linked assets to turn south again at some point and for the greenback to wear its safe haven suit and start shining again, although it may also continue correcting for a while more. We repeat that in order to change our view, a vaccine has to be ready for distribution, and certainly the vaccine in this case is not fiscal spending, neither monetary policy easing.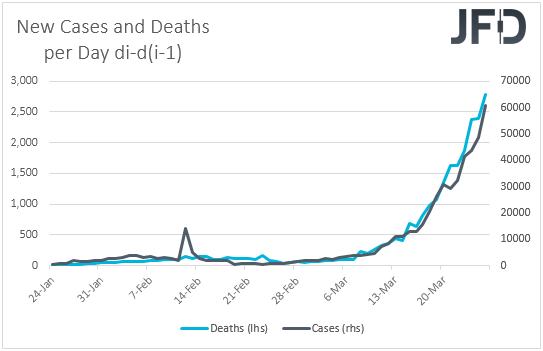
Apart from the jobless claims, which took center stage yesterday, we also had a BoE gathering, but as it was expected, it was proven a non-event. Under the leadership of the new Governor, Andrew Bailey, policymakers decided to keep interest rates unchanged at +0.10%, and also agreed unanimously to continue with the program of GBP 200bn of UK government bond and sterling non-financial investment-grade corporate bond purchases, to take the total stock of these purchases to GBP 645 billion. With regards to their future plans, they noted that they will continue to monitor the situation closely and that they stand ready to respond further if needed.
DJIA – TECHNICAL OUTLOOK
Yesterday the Dow Jones Industrial Average index surpassed the 22000 mark and closed the trading session above it. This morning, the cash index continues to float above that hurdle. Although DJIA showed some good results over the past few trading sessions, the price still remains below a short-term tentative downside resistance line taken from the high of February 20th. Despite having a good run to the upside in the past few days, we will stay cautious for now. given Dow’s proximity to the above-mentioned downside line. A further recovery might be limited near that line. However, for us to get comfortable with the downside again, we would like to see the price moving back below the 22000 mark and staying there.
As mentioned above, if the index fails to overcome the aforementioned downside line and drops below the 22000 handle again, that’s when more sellers may join in and drive DJIA lower. The next possible support area to consider might be between the 19994 and 20500 levels, marked by the high of March 23rd and near the low of March 25th respectively. The price could stall there, or even correct back up a bit. That said, if this rebound only takes a short while, then we could see another round of selling, as the bears might take advantage of the higher price. If that happens and the DJIA drops below the 19994 territory, this would confirm another lower low and the next support level to consider might be the current low of March on the cash index, at around 18200 zone.
On the other hand, if the previously-mentioned downside line breaks and the index also drifts above the 23160 barrier, marked by the high of March 13th, this may attract more bulls into the field. If so, the DJIA could travel higher and target the 25056 obstacle, a break of which may set the stage for a test of the 26000 territory, marked near the high of March 6th.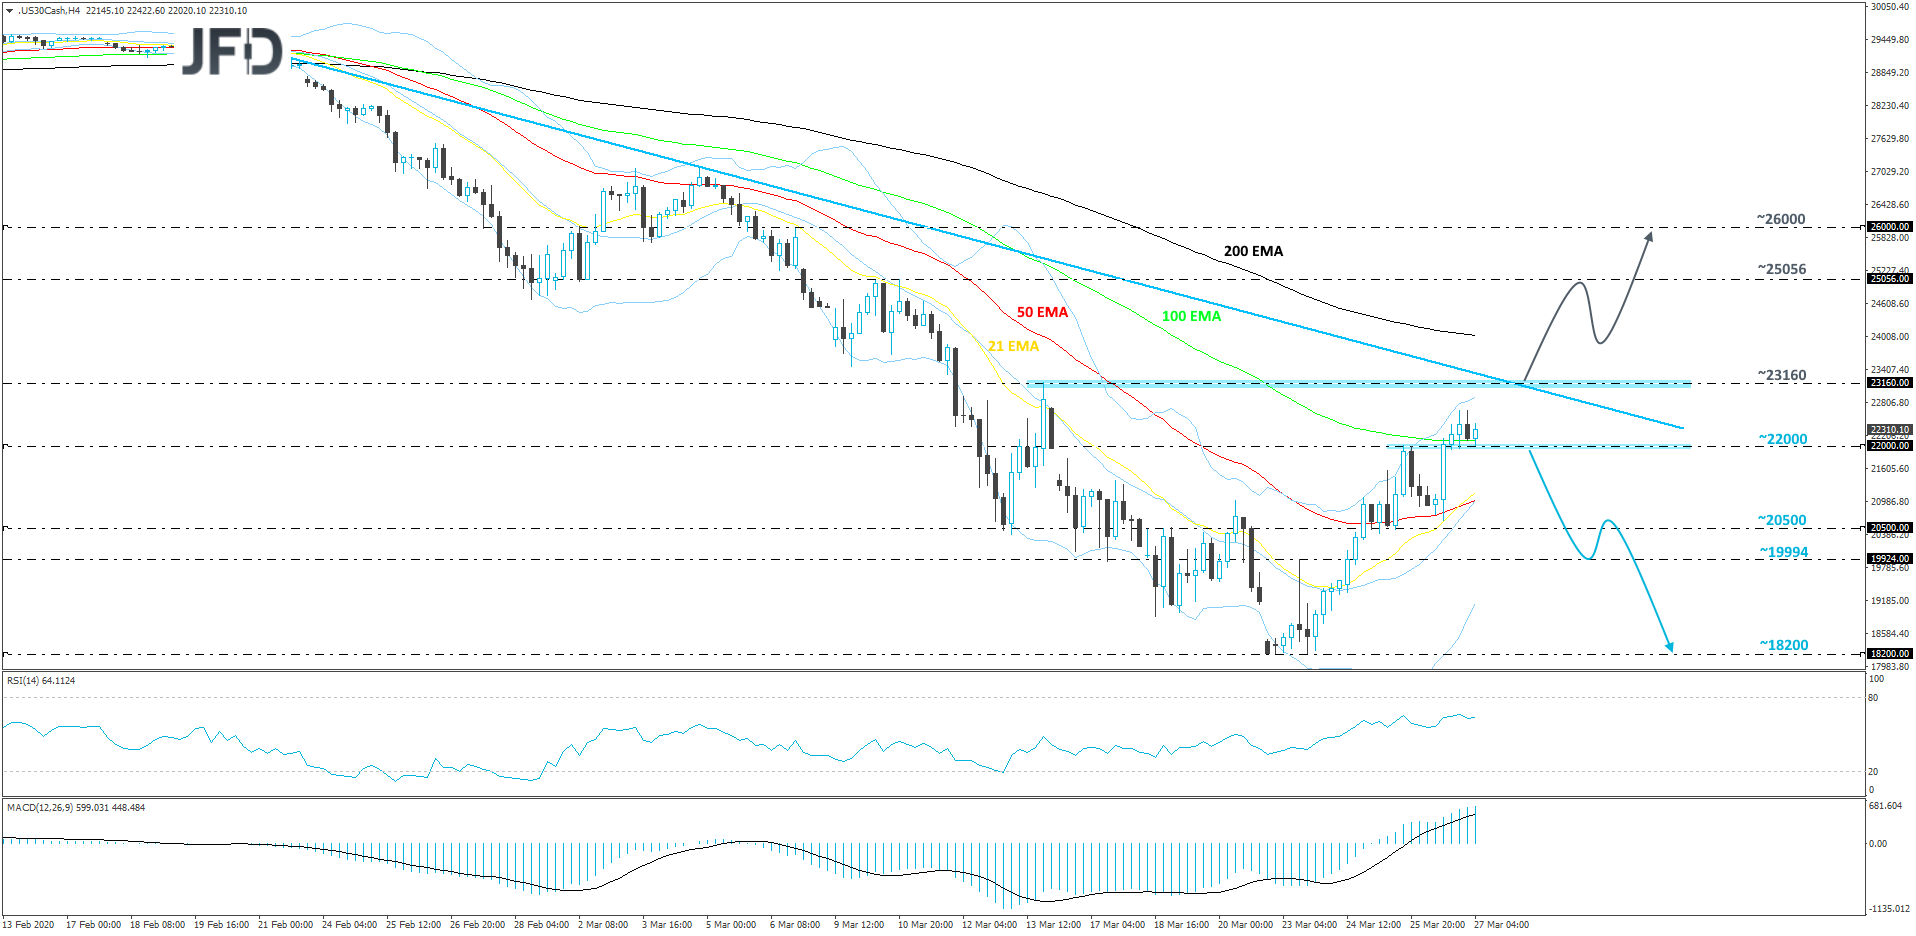
USD/CHF – TECHNICAL OUTLOOK
USD/CHF fell below a short-term tentative upside support line yesterday, which is drawn from the lowest point of March. In addition to that, the pair slid below all of its EMAs on the 4-hour chart, which just creates more pressure from the bears. That said, this morning we are seeing a bit of a correction higher, which means there is a chance to see a bit more upside in the near term. However, if the rate remains below the 0.9638 hurdle, or the 200 EMA, this could attract the bears again. For now, we will take a cautiously-bearish approach.
As discussed above, USD/CHF may rise a bit higher and test the 0.9638 hurdle, which is the low of March 19th, or it could test the 200-EMA on the 4-hour chart. If one of those areas provides good resistance, this may help the bears to push the pair back down towards the 0.9566 zone, marked by the low of March 18th, a break of which could set the stage for a further drift lower. The next possible support level to consider could be at 0.9500, marked by an intraday swing high of March 16th.
On the upside, if the pair travels back above the aforementioned upside line and the rate gets pushed above the 0.9783 barrier, marked by an intraday swing low of March 25th, this may attract more bulls into the field again. If so, USD/CHF could get another boost and might travel to the high of March 24th, at 0.9845. The rate may stall around there, or even correct a bit lower. That said, if it stays above the aforementioned upside line, we will remain positive over the near term. Another push higher could break the 0.9845 obstacle, which could clear the path to the 0.9900 area. That area is the current highest point of this year. Slightly above it lies another potential resistance level, at 0.9926, marked by the high of December 3rd, 2019.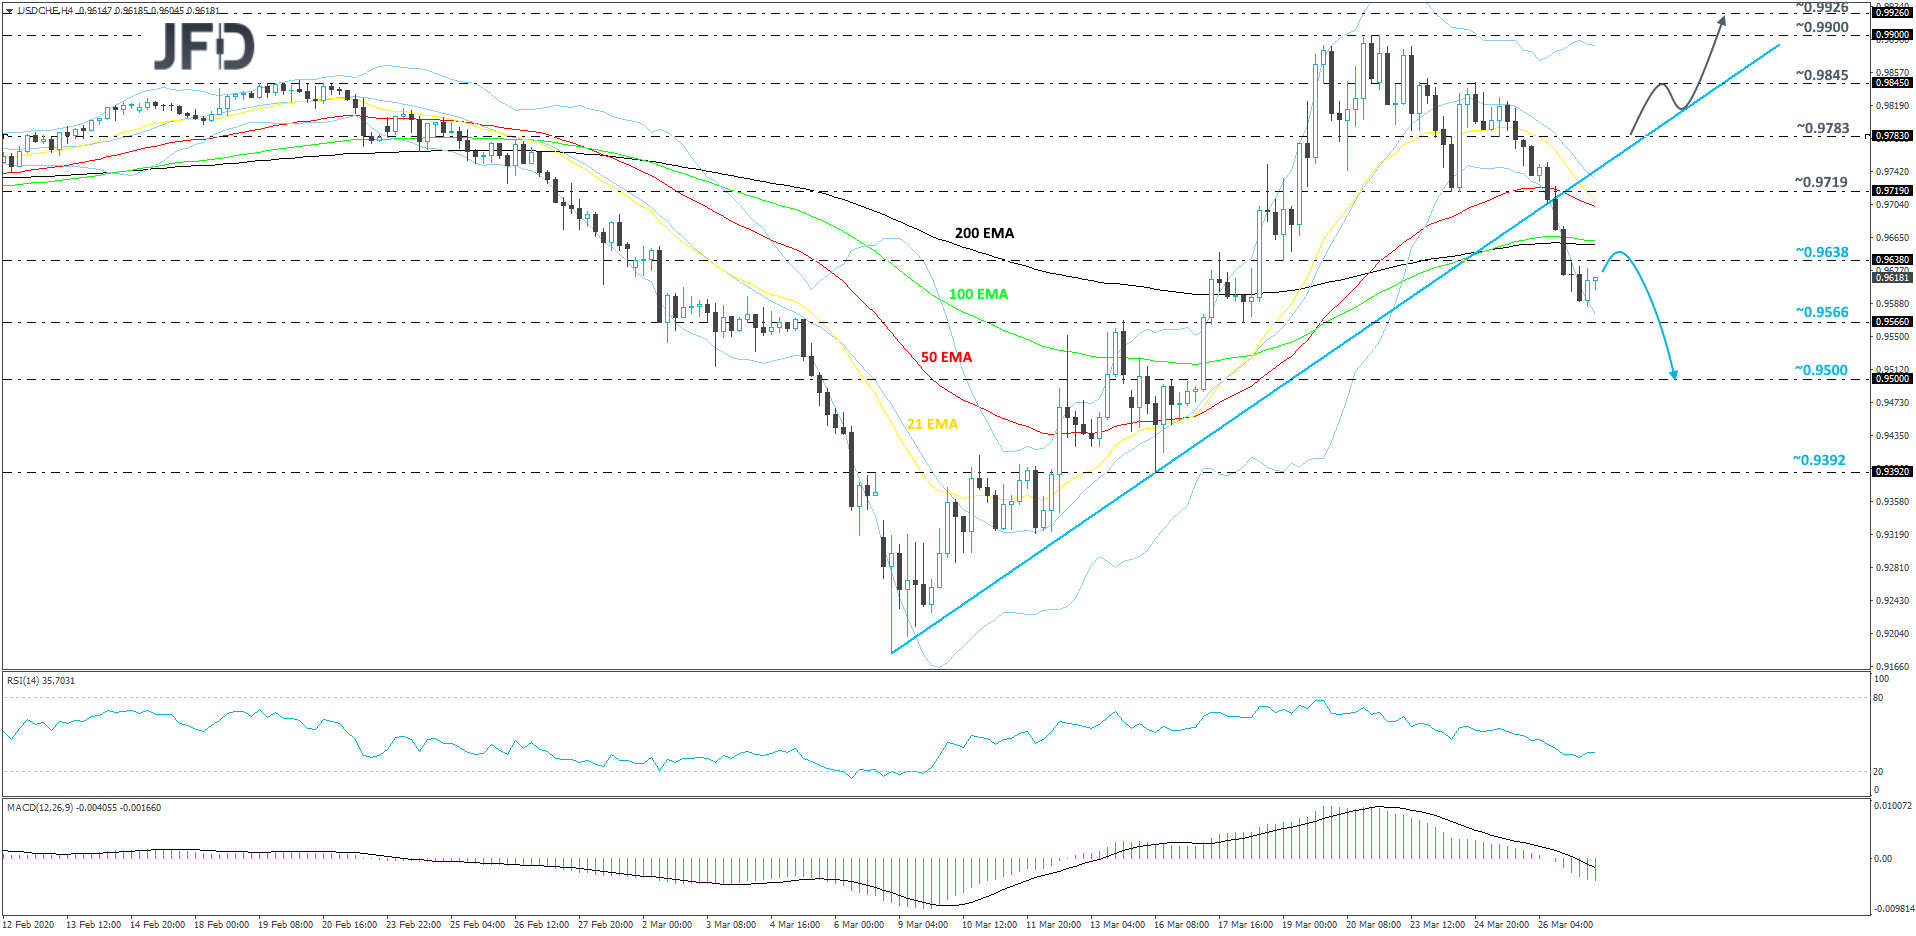
AS FOR TODAY’S EVENTS
We get the US personal income and spending data for February, alongside the core PCE yoy rate for the month. Personal income is forecast to have slowed to +0.4% mom from +0.6%, something supported by the slide of the average hourly earnings mom rate for the month, while personal spending is anticipated to have grown +0.2% mom, the same pace as in January. That said, bearing in mind that retail sales for the month slid 0.5% mom, we see the risks surrounding the spending forecast as tilted to the downside. With regards to the core PCE yoy rate, which is the Fed’s favorite inflation metric, it is expected to have ticked up to +1.7% yoy from +1.6%.
Having said all that though, we don’t expect these data sets to alter expectations around monetary policy. The Fed and other major central banks have been in a coordinated rescue mission, easing massively their respective policies in order to prevent the global economy from falling into recession, or at least recover as quickly as possible in case it does. Thus, data may have been put aside for now, with investors not paying the attention they would have under normal circumstances.
- English (UK)
- English (India)
- English (Canada)
- English (Australia)
- English (South Africa)
- English (Philippines)
- English (Nigeria)
- Deutsch
- Español (España)
- Español (México)
- Français
- Italiano
- Nederlands
- Português (Portugal)
- Polski
- Português (Brasil)
- Русский
- Türkçe
- العربية
- Ελληνικά
- Svenska
- Suomi
- עברית
- 日本語
- 한국어
- 简体中文
- 繁體中文
- Bahasa Indonesia
- Bahasa Melayu
- ไทย
- Tiếng Việt
- हिंदी
“Risk On” Prevails Despite Record Jobless Claims
Published 03/27/2020, 04:54 AM
Updated 07/09/2023, 06:31 AM
“Risk On” Prevails Despite Record Jobless Claims
3rd party Ad. Not an offer or recommendation by Investing.com. See disclosure here or
remove ads
.
Latest comments
Install Our App
Risk Disclosure: Trading in financial instruments and/or cryptocurrencies involves high risks including the risk of losing some, or all, of your investment amount, and may not be suitable for all investors. Prices of cryptocurrencies are extremely volatile and may be affected by external factors such as financial, regulatory or political events. Trading on margin increases the financial risks.
Before deciding to trade in financial instrument or cryptocurrencies you should be fully informed of the risks and costs associated with trading the financial markets, carefully consider your investment objectives, level of experience, and risk appetite, and seek professional advice where needed.
Fusion Media would like to remind you that the data contained in this website is not necessarily real-time nor accurate. The data and prices on the website are not necessarily provided by any market or exchange, but may be provided by market makers, and so prices may not be accurate and may differ from the actual price at any given market, meaning prices are indicative and not appropriate for trading purposes. Fusion Media and any provider of the data contained in this website will not accept liability for any loss or damage as a result of your trading, or your reliance on the information contained within this website.
It is prohibited to use, store, reproduce, display, modify, transmit or distribute the data contained in this website without the explicit prior written permission of Fusion Media and/or the data provider. All intellectual property rights are reserved by the providers and/or the exchange providing the data contained in this website.
Fusion Media may be compensated by the advertisers that appear on the website, based on your interaction with the advertisements or advertisers.
© 2007-2024 - Fusion Media Limited. All Rights Reserved.