Do you think the US housing industry will bounce back in 2012 or 2013? The housing recovery theme has attracted more believers in recent months, as US economic data has mostly improved, and homebuilder stocks have risen.
Warren Buffett has been calling for a housing rebound for quite some time, and is predicting the start of a recovery in 2012, citing 1 million housing starts/year as a key target of industry growth. The NAHB reported that the pace through Nov. calls for 685,000 starts in 2011, which is 98,000, (16.7%), higher than 2010. The Northeast jumped 41%, the West rose 36%, the South rose 12%, and the Midwest fell 8%.
Fed Chairman Bernanke has also stated in a Fall 2011 speech that, “Over the medium term, housing activity will stabilize and begin to grow again, if for no other reason than that ongoing population growth and household formation will ultimately demand it”. A Sept. 2011 Harvard University study forecasts the amount of new US household formations during the decade between 2010 and 2020 will be at least 11.8 million.
Toll Bros., (TOL), a mid- to upscale market builder, has survived the housing crash reasonably well, and was, unexpectedly, one of the best stocks to buy in 2011 for price gains, as it rose over 7%, vs. 0% for the S&P. TOL continues to capitalize on cheap land prices, via a combination of land purchase options and outright purchases. They’ve taken substantial impairments on their existing pre-crash land portfolio.
TOL is one of the few US homebuilder stocks who have positive earnings, however, this is still due to the use of accrued tax benefits which they’ve accumulated from prior years’ losses. They have tax benefits worth $104 million-plus that they can still write off, as of 10/31/11. Toll Bros. also has one of the lowest debt loads in the housing industry, with a Debt/Equity Ratio of .65.
TOL’s recent quarter EPS growth decline was due to FY 2011’s fourth quarter only including a tax expense of $0.2 million, vs. a $59.9 million net tax benefit in FY 2010’s fourth quarter. On a pre-tax basis, TOL’s income rose by nearly $25M , as they reported FY 2011 fourth-quarter pre-tax income of $15.3 million, vs. FY 2010’s fourth-quarter pre-tax loss of $9.5 million.
TOL has also moved into lucrative urban markets, such as New York’s Manhattan and Brooklyn boroughs, and DC suburbs, where housing in trendy neighborhoods has traditionally been a tight, lucrative market. Their 2011 10K report states, “In order to serve a growing market of affluent move-up families, empty-nesters and young professionals seeking to live in or close to major cities, we have developed and are developing a number of high-density, high-, mid- and low-rise urban luxury communities and are in the process of converting several for-rent apartment buildings to condominiums”
“These communities, which we are currently developing on our own or through joint ventures, are located in Dublin and San Jose, California; Singer Island, Florida; Chicago, Illinois suburbs; North Bethesda, Maryland; Hoboken, New Jersey; the boroughs of Manhattan and Brooklyn, New York; Philadelphia, Pennsylvania and its suburbs; and Leesburg, Virginia.”
“We believe that the demographics of the move-up, empty-nester, active-adult, age-qualified and second-home upscale markets will provide us with the potential for growth in the coming decade. According to the U.S. Census Bureau, the number of households earning $100,000 or more (in constant 2010 dollars) at September 2011 stood at 24.3 million, or approximately 20.5% of all U.S. households. This group has grown at four times the rate of increase of all U.S. households since 1980.” (Source: Toll Bros. 12/22/11 10Q Report)
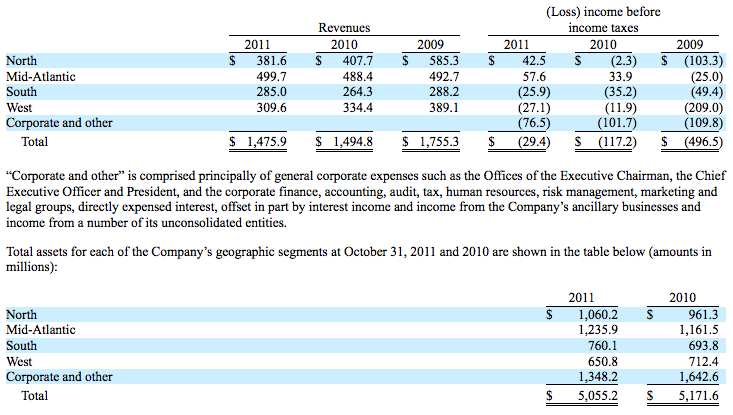
TOL’s pre-tax income and revenue breakdown by geographic segment shows mostly improving trends, and also shows that the North and Mid-Atlantic regions are currently driving their profits, which is in line with the Northeast’s housing starts gains we mentioned earlier. Toll noted that its North segment’s 2011 revenue decrease was mainly due to many communities there being sold out:
If you feel that the US employment picture will eventually improve in 2013, and improve Toll Bros’ sales and profitability along with it, TOL may be one of the best stocks to buy in 2012 for a long term speculative US housing trade, via selling cash secured puts, below TOL’s current share price. There are LEAPS available, (long-term equity appreciation security options), which don’t expire until Jan. 2014, which would give these trades the benefit of time to develop:
The table illustrates how the put options’ yields and premiums decrease, the further below TOL’s current stock price the put strike price is. As always, there’s a trade-off between risk and reward. Although the annualized yields aren’t very high on these trades, unlike dividends, you’ll receive your put premium $ within 3 days of selling put options. Your broker will hold a cash reserve equal to the amount of puts that you sell, times the strike price, times 100. (Each options contract corresponds to 100 shares of the underlying stock.) For example, selling one $13.00 put option requires a cash reserve of $1,300.00, and obligates you to potentially have to buy 100 shares of TOL at $13.00, if it falls below $13.00 before expiration in Jan. 2014. Generally, most options aren’t exercised until close to or at expiration, because it’s usually more profitable for the option buyers to just trade the options themselves, instead of selling the underlying stock.
The other attraction that selling options offers is tax deferral: If you’re able to let these options expire in Jan. 2014, your tax bill won’t be due until April 2015. So, you’ll get paid up front, and have tax-deferred use of the option $ you receive for over 2 years.
(Note: You can see more info on over 30 high yield Cash Secured Puts trades in our Cash Secured Puts Table.)
Although Toll doesn’t pay dividends, they do have a 20 million share buyback program, which they started in 2003, and greatly accelerated in 2011. The plan still has 8,786,000 shares that can be repurchased:
One thing to beware of in this long term speculative trade, is that there’s a fair amount of short interest against TOL, and many other US homebuilders. In comparison, Lennar has a short float nearing 20%, and a higher beta of 1.71:
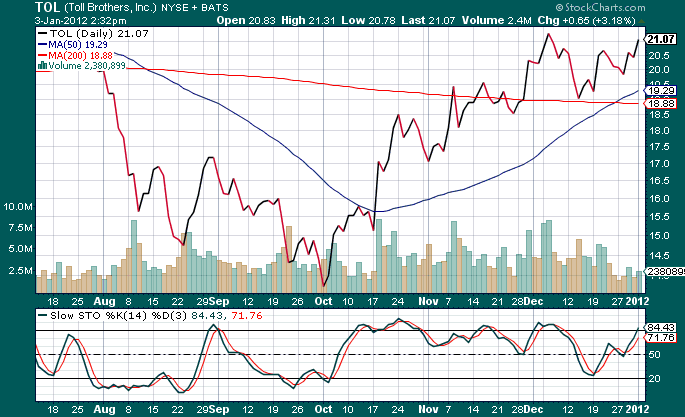
The homebuilders have had quite a runup in recent months, and TOL looks overbought on a stochastic chart, so you may be able to achieve even higher put premiums by waiting for the next pullback, when TOL’s share price should decline, and its put prices rise.
Disclosure: Author has no positions in TOL, LEN, or DHI at the time of publication.
Disclaimer: This article is written for informational purposes only and isn’t intended as investment advice.
- English (UK)
- English (India)
- English (Canada)
- English (Australia)
- English (South Africa)
- English (Philippines)
- English (Nigeria)
- Deutsch
- Español (España)
- Español (México)
- Français
- Italiano
- Nederlands
- Português (Portugal)
- Polski
- Português (Brasil)
- Русский
- Türkçe
- العربية
- Ελληνικά
- Svenska
- Suomi
- עברית
- 日本語
- 한국어
- 简体中文
- 繁體中文
- Bahasa Indonesia
- Bahasa Melayu
- ไทย
- Tiếng Việt
- हिंदी
Profiting Now From A 2014 US Housing Rebound
Published 01/05/2012, 04:02 AM
Updated 07/09/2023, 06:31 AM
Profiting Now From A 2014 US Housing Rebound
Latest comments
Loading next article…
Install Our App
Risk Disclosure: Trading in financial instruments and/or cryptocurrencies involves high risks including the risk of losing some, or all, of your investment amount, and may not be suitable for all investors. Prices of cryptocurrencies are extremely volatile and may be affected by external factors such as financial, regulatory or political events. Trading on margin increases the financial risks.
Before deciding to trade in financial instrument or cryptocurrencies you should be fully informed of the risks and costs associated with trading the financial markets, carefully consider your investment objectives, level of experience, and risk appetite, and seek professional advice where needed.
Fusion Media would like to remind you that the data contained in this website is not necessarily real-time nor accurate. The data and prices on the website are not necessarily provided by any market or exchange, but may be provided by market makers, and so prices may not be accurate and may differ from the actual price at any given market, meaning prices are indicative and not appropriate for trading purposes. Fusion Media and any provider of the data contained in this website will not accept liability for any loss or damage as a result of your trading, or your reliance on the information contained within this website.
It is prohibited to use, store, reproduce, display, modify, transmit or distribute the data contained in this website without the explicit prior written permission of Fusion Media and/or the data provider. All intellectual property rights are reserved by the providers and/or the exchange providing the data contained in this website.
Fusion Media may be compensated by the advertisers that appear on the website, based on your interaction with the advertisements or advertisers.
© 2007-2024 - Fusion Media Limited. All Rights Reserved.
