- U.S. futures, global shares drop on U.S.-Iran 'end of diplomacy', FedEx lawsuit against U.S. government
- Gold, yen, Treasurys gain ground on mounting geopolitical risk
- Yuan, Korean won head for further losses
- Bitcoin crosses $11,000
- Fed Chairman Jerome Powell will discuss the challenges facing the U.S. economy at the Council on Foreign Relations in New York on Tuesday.
- Also on Tuesday, MSCI Inc. announces results of its 2019 Market Classification Review, including whether Kuwait gets upgraded from frontier to emerging-market status.
- The Group of 20 two-day summit kicks off is in Osaka, Japan, on Friday.
- The U.K.’s FTSE 100 slid 0.5% to the lowest in more than a week.
- The MSCI Emerging Market Index dropped 0.4%, the biggest dip in more than a week.
- The MSCI Asia Pacific Index declined 0.3%.
- The Dollar Index rebounded from a 0.1% drop, which would have reached the lowest in almost 3 months on what would have been its fifth straight decline.
- The euro slipped less than 0.05% to $1.1397, the first retreat in a week.
- The British pound rose 0.2% to $1.2764, reaching the strongest in almost six weeks on its sixth consecutive advance.
- The Japanese yen climbed 0.3% to 107.01 per dollar, the strongest in more than 14 months.
- The yield on 10-year Treasurys fell one basis point to 2.00%, the lowest in more than two years.
- Germany’s 10-year yield edged less than one basis point lower to -0.31%.
- Britain’s 10-year yield gained less than one basis point to 0.819%.
- West Texas Intermediate crude fell 0.2% to $57.77 a barrel.
- Gold gained 0.8% to $1,431.02 an ounce, reaching the highest in more than six years on its sixth consecutive advance.
Key Events
Futures on the S&P 500, Dow and NASDAQ 100 tracked global stocks lower this morning after both U.S.-China and U.S.-Iran tensions reached a new peak. Increased demand for safe havens boosted gold and the yen, while sending yields on 10-year Treasurys back to 2.00%.
In Europe, losses affecting almost all sectors pushed the STOXX 600 into a third-day slide.
In the earlier Asian session, regional shares reversed gains on a report Iran said new U.S. sanctions would mean "the permanent closure of the path of diplomacy,” spurring investor search for safety.
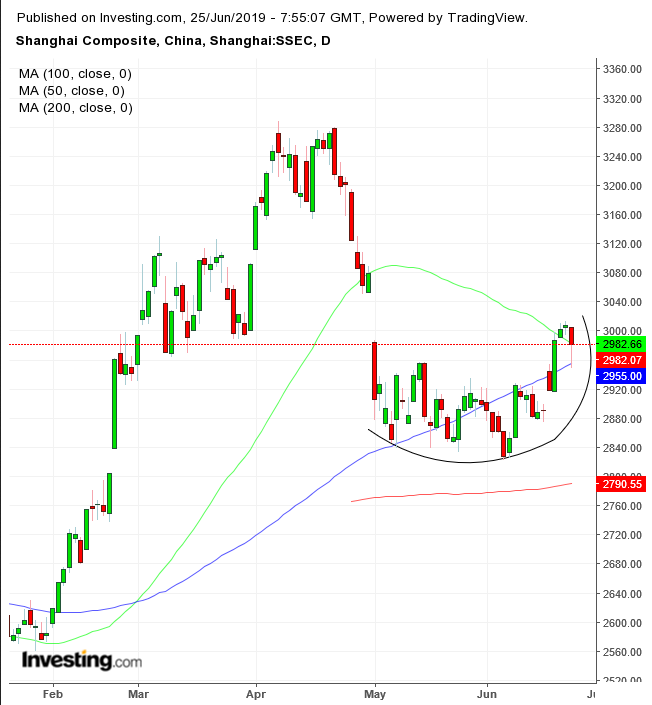
China’s Shanghai Composite dropped 0.87% ahead of the crucial Trump-Xi talks, where a lot could go wrong. Complicating the matter was a move from U.S. shipping company FedEx (NYSE:FDX) this morning to sue the U.S. Commerce Department over export restrictions on Huawei, in the wake of criticism from Chinese officials on Monday on how the U.S. shipper recently mishandled product deliveries from the Chinese telecom giant.
Technically, the Chinese benchmark slipped back below the 50 DMA, while finding support above the 100 DMA as it potentially completes a rounding bottom—which is itself supported by the 200 DMA.
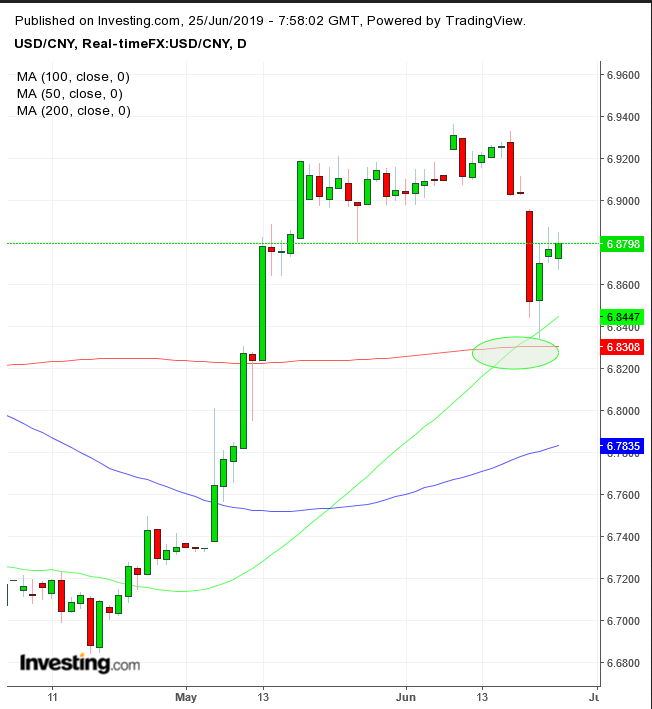
The Chinese yuan weakened for a third day, after the USD/CNY pair found support above the 50 DMA and 200 DMA amid a golden cross. This suggests a continued weakening for the yuan, which in turn could potentially exacerbate trade talks further.
For its part, Hong Kong’s Hang Seng (-1.15%) underperformed ahead of the much-anticipated meeting between Trump and his Chinese counterpart Xi Jinping, which comes at a time when U.S. lawmakers have been urged to consider sanctions against Hong Kong—a Special Administrative Region of the Chinese state—and China ruled out discussing the thorny issue at the G20 summit.
South Korea’s KOSPI contained losses to 0.22%, ranking second best after Australia’s S&P/ASX 200 (-0.11%). The Korean benchmark may soon benefit from an interest rate cut after the yield curve inversion between the country's long-term bonds and the overnight policy rate widened to an all-time high.
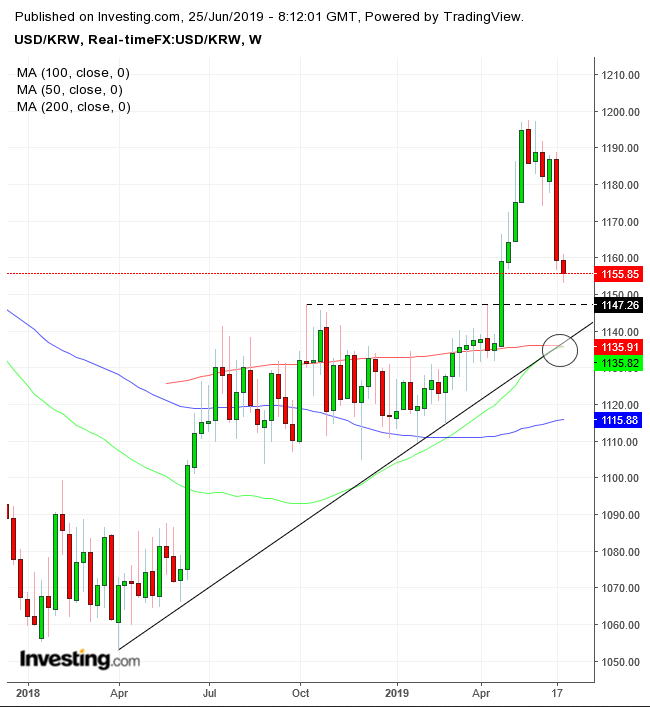
The stronger case for a rate cut would carry an opposite downward effect on to the won. Technically, the USD/KRW is nearing a dual support of the 1,150.00 price—the highs of 2018 and 2019—even as the uptrend line reached these levels. The 50 DMA is on the verge of crossing over the 200 DMA, setting up a golden cross.
Meanwhile, adding to existing trade headwinds, Bloomberg revealed U.S. President Donald Trump vented frustration about the six-decades old defense pact with Japan, considering it unfair to the U.S.
Global Financial Affairs
Yesterday, U.S. equities slid away from record highs as resurfacing fears of a slowing economy offset recent signs of monetary policy easing. The Russell 2000 underperformed (-1.17%), falling below the 200 DMA, either on hopes of a successful U.S.-China trade summit or on increased caution, whereby small caps provide a risk proxy.
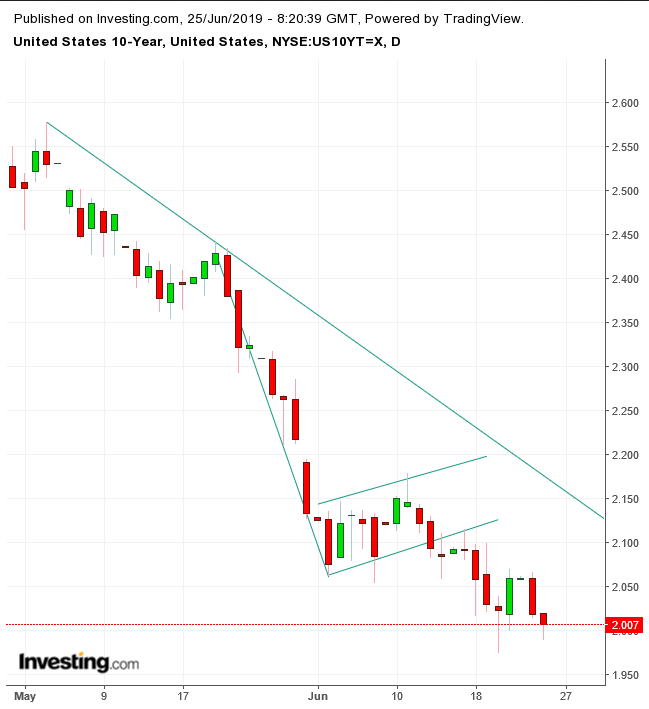
Meanwhile, yields extended a drop, probably more on risk off than on the path to lower interest rates, which may have already been priced in. Technically, the 10-year yield is squeezed between a potentially completed return move toward a bearish flag—which would extend the downtrend—and last week’s lows.
In crypto news, after four attempts Bitcoin finally managed to scale above the $11,000 level, hovering at the $11,400 levels by the European midday session.
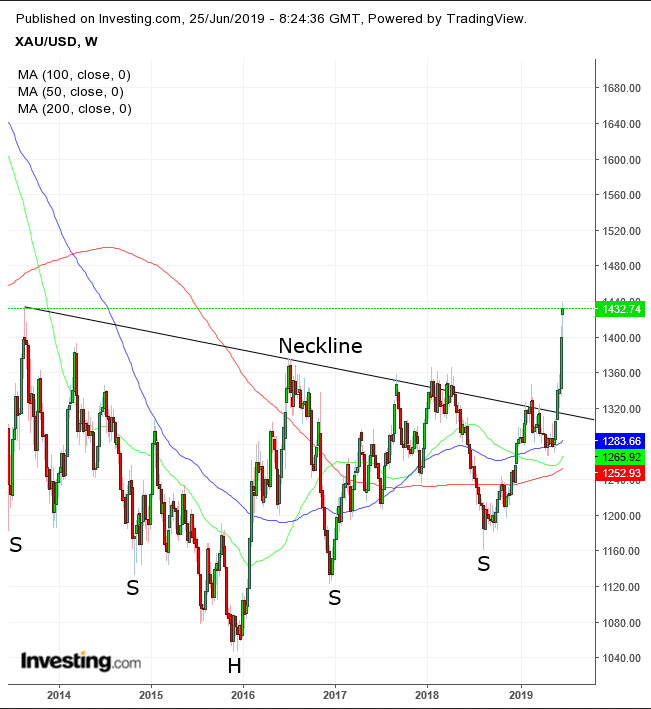
In safe haven markets, gold continued its spree to the highest levels since 2013, after completing a massive six-year long, $250 deep, H&S bottom, setting in motion a macro uptrend.
The yen kept strengthening, having recently also benefited from the Bank of Japan's hawkish stance relative to the global easing trend and to the Fed's dovishness. Technically, the USD/JPY pair extended a slide after crossing below the long-term uptrend line since June 2016 as the 50 WMA curved below the 200 WMA.
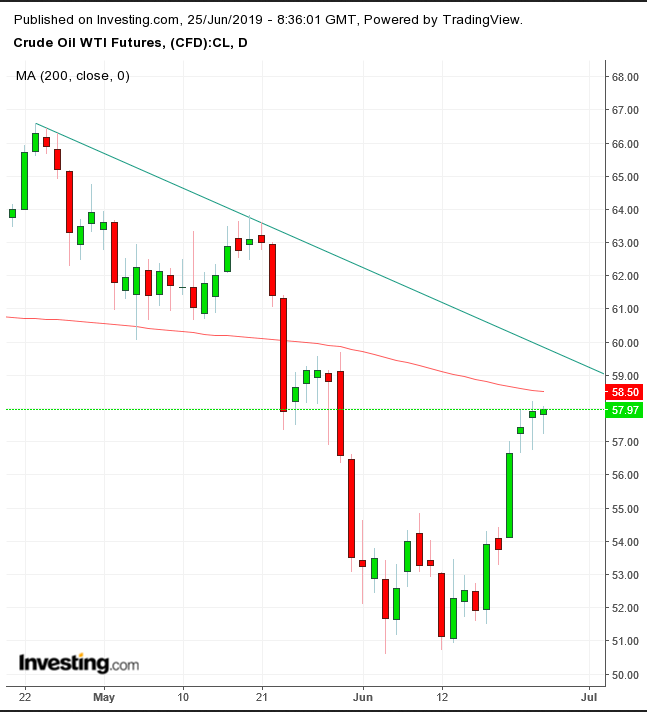
Finally, oil prices dropped for a third day as ongoing concerns over falling global demand, as well as uncertainty around an extension of supply cuts by OPEC+ producers, offset the U.S.-Iran standoff. Technically, the price found resistance by the 200 DMA, guarding the downtrend line since April 23.
Up Ahead
Market Moves
Stocks
Currencies
Bonds
Commodities
