The Mid Cap Value style ranks seventh out of the twelve fund styles as detailed in our 3Q19 Style Ratings for ETFs and Mutual Funds report. Last quarter, the Mid Cap Value style ranked eighth. It gets our Neutral rating, which is based on an aggregation of ratings of nine ETFs and 178 mutual funds in the Mid Cap Value style as of July 15, 2019. See a recap of our 2Q19 Style Ratings here.
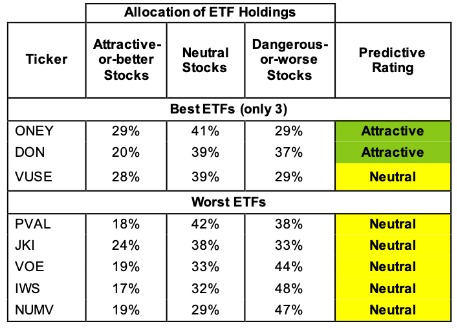
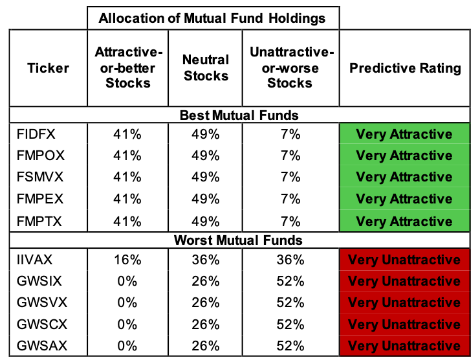
Figure 1 ranks from best to worst the eight Mid Cap Value ETFs that meet our liquidity standards and Figure 2 shows the five best and worst-rated Mid Cap Value mutual funds. Not all Mid Cap Value style ETFs and mutual funds are created the same. The number of holdings varies widely (from 26 to 2076). This variation creates drastically different investment implications and, therefore, ratings.
Investors seeking exposure to the Mid Cap Value style should buy one of the Attractive-or-better rated ETFs or mutual funds from Figures 1 and 2.
Our Robo-Analyst technology[1] empowers our unique ETF and mutual fund rating methodology, which leverages our rigorous analysis of each fund’s holdings.[2] We think advisors and investors focused on prudent investment decisions should include analysis of fund holdings in their research process for ETFs and mutual funds.

* Best ETFs exclude ETFs with TNAs less than $100 million for inadequate liquidity.
Sources: New Constructs, LLC and company filings
First Trust Multi Cap Value AlphaDEX Fund (NASDAQ:FAB) is excluded from Figure 1 because its total net assets (TNA) are below $100 million and do not meet our liquidity minimums.

* Best mutual funds exclude funds with TNAs less than $100 million for inadequate liquidity.
Sources: New Constructs, LLC and company filings
Fidelity Mid Cap Value K6 Fund (FCMVX) is excluded from Figure 2 because its total net assets (TNA) are below $100 million and do not meet our liquidity minimums.
State Street (NYSE:STT) SPDR Russell 1000 Yield Focus ETF (NYSE:ONEY) is the top-rated Mid Cap Value ETF and Fidelity Advisor Mid Cap Value Fund (FIDFX) is the top-rated Mid Cap Value mutual fund. ONEY earns an Attractive rating and FIDFX earns a Very Attractive rating.
NuShares Nuveen ESG Mid Cap Value ETF (NYSE:NUMV) is the worst rated Mid Cap Value ETF and Gabelli Focus Five Fund (GWSAX) is the worst rated Mid Cap Value mutual fund. NUMV earns a Neutral rating and GWSAX earns a Very Unattractive rating.
The Danger Within
Buying a fund without analyzing its holdings is like buying a stock without analyzing its business and finances. Put another way, research on fund holdings is necessary due diligence because a fund’s performance is only as good as its holdings’ performance. Don’t just take our word for it, see what Barron’s says on this matter.
PERFORMANCE OF HOLDINGs = PERFORMANCE OF FUND
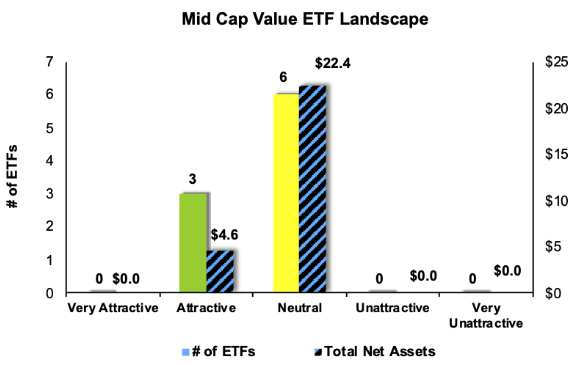
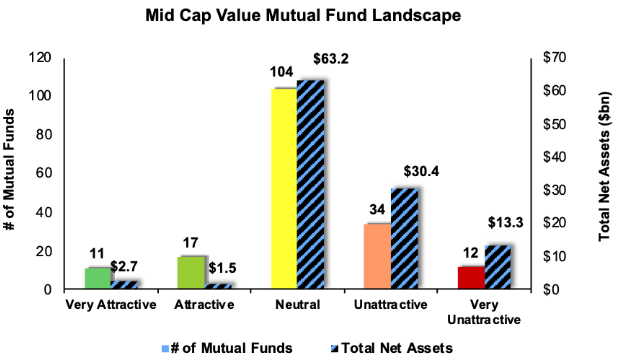
Figures 3 and 4 show the rating landscape of all Mid Cap Value ETFs and mutual funds.

Sources: New Constructs, LLC and company filings

Sources: New Constructs, LLC and company filings
