Authors Lu Wang and Joseph Ciolli at Bloomberg described the fear of U.S. stocks falling as “bubble paranoia.” Yet, if fundamental and technical indicators both suggest that U.S. stock assets are extremely overvalued, is the maladjustment with some investors or with the markets themselves?
The above-mentioned writers explained that U.S. Federal Reserve members believe asset prices are in line with historical norms. So that means that asset prices are not ballooning? This is the same institution that did not see the housing bubble or the subsequent credit crunch prior to the 2008 financial collapse; it is also the same institution that has overestimated economic growth in every single year since the 2009 recovery began.
The real trouble with relying on the Fed’s convictions alone is the foaminess of the data itself. Margin debt is at record highs. Credit spreads are at record lows. Most notably, U.S. stock prices are more expensive than 82% of previous bull market peaks based upon book value, 86% of prior market tops based upon 10 years of profits/earnings and 89% of preceding high-water marks based upon revenue/sales.
In some instances, financial researchers have declared the 2014 U.S. stock market as a bronze medalist in effervescence. Andrew Smithers, the chairman of Smithers & Co., did an analysis of a combination of respected measures (i.e., subsequent 30-year returns, Tobin’s Q, etc.) to determine the extent of stock overvaluation. The findings? Other than 1929 and 1999, the U.S. stock tire has more air in it than ever before. Makes one think of Joseph Heller’s Catch-22 – “Just because you’re paranoid, doesn’t mean they’re not after you.”
In fairness to the authors, they acknowledged that the S&P 500 has not corrected 10% in more than 33 months. That said, what they missed is equally telling. The S&P 500 is currently enjoying its longest streak above a 200-day trendline in the history of the index — 415 days and counting. Before the 1990 bear market, the S&P 500 experienced 286 trading days of tranquility (11/88-1/90). Before the 2007 subprime-inspired recession, the benchmark followed a northeasterly wind for 240 consecutive trading sessions (8/06-7/07). But a record 415 days without a serious test of the long-term moving average? It is not only unprecedented, it is ominous.
Perhaps ironically, investors may be smack in the middle of a difficult situation for which a simple solution does not exist. (Yep… there’s another “catch 22″ reference.) Former Fed Chairman Alan Greenspan questioned the rationality of the exuberance of asset prices in 1996. However, the bubble did not burst for three-and-a-half more years. In a zero percent rate environment that could just as easily carry forward into 2016 or 2017 as it might end in mid-2015, stocks could grind higher in spite of valuations. The so-called paranoia may even be helpful in pushing back on the type of euphoria that turns the last of the naysayers bullish.
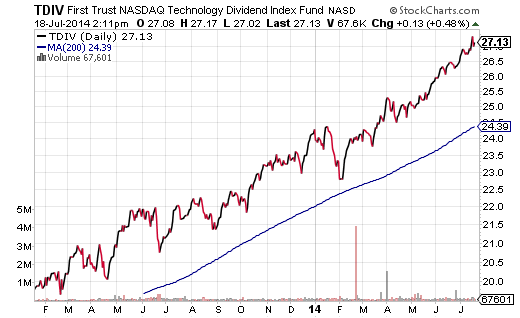
The difficult situation, then, is that you do need to maintain stock ETFs in your portfolio, regardless of stretched fundamentals. I prefer iShares MSCI USA Low Volatility (NYSE:USMV) and First Trust Technology Dividend (NASDAQ:TDIV). I will continue to hold these assets until stop-limit loss orders and/or long-term moving averages break. It is also sensible to look at foreign assets that do not have stretched valuations, and by most measures, are bona fide bargains. Think iShares MSCI Asia excl Japan (NASDAQ:AAXJ).
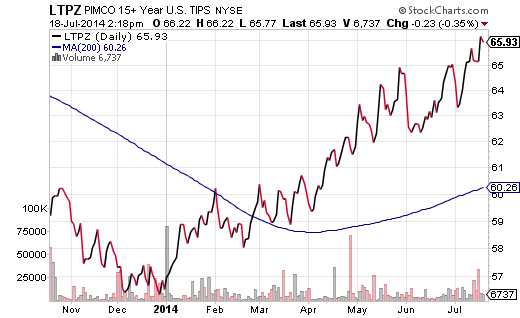
At a time when stocks are likely to experience a correction of 10% or more — whether it is due to valuation concerns, geopolitical hazards, or probability itself — investors need to own the other side of the barbell as well. All year long, I’ve explained the rationale for why long-term rates would fall, not rise. Funds like PIMCO 15+ Year TIPS (NYSE:LTPZ) and Vanguard Extended Duration (NYSE:EDV) have been downright remarkable in their capital appreciation. Even better, they will help hedge your stock exposure so that you will be able to sleep better at night.
Disclosure: Gary Gordon, MS, CFP is the president of Pacific Park Financial, Inc., a Registered Investment Adviser with the SEC. Gary Gordon, Pacific Park Financial, Inc, and/or its clients may hold positions in the ETFs, mutual funds, and/or any investment asset mentioned above. The commentary does not constitute individualized investment advice. The opinions offered herein are not personalized recommendations to buy, sell or hold securities. At times, issuers of exchange-traded products compensate Pacific Park Financial, Inc. or its subsidiaries for advertising at the ETF Expert web site. ETF Expert content is created independently of any advertising relationships.


