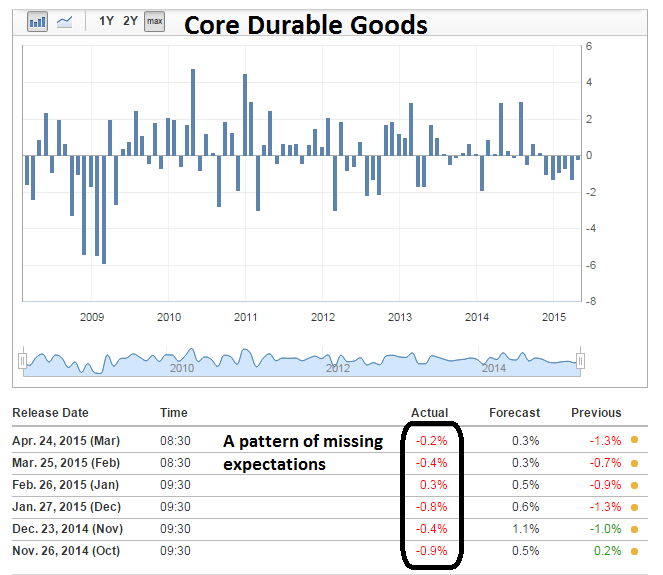
I've spilled a lot of ink about how capital expenditures have been missing in this cycle (for examples see CapEx: Still waiting for Godot and CapEx is still MIA). Last week, Durable Goods Orders continued a pattern of missing expectation.

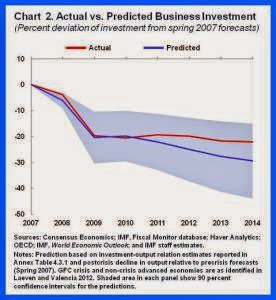
The question has always been, "How can the economy grow if companies don't invest in capital equipment?" In its latest World Economic Outlook published April 2015, the IMF attributed anemic CapEx to a lack of demand:
Using a novel statistical approach that deals with reverse causality running from investment to output, we confirm that business investment has deviated little from what could be expected given the weakness in economic activity (see chart 2). In other words, firms have reacted to weak sales—both current and prospective—by reducing capital spending. Indeed, when businesses are asked about the main challenges facing them, they typically report lack of customer demand as the dominant factor.

Knowledge Based Capital ascendant?
There may be another explanation. There were some tantalizing clues in a 2012 OECD study, New Sources of Growth: Knowledge-Based Capital Driving Investment and Productivity in the 21st Century. The study focused on the effects of Knowledge based capital, or KBC, and its economic effects:
Covering various time periods, growth accounting studies show a positive relationship between business investment in KBC and macroeconomic growth and productivity change. It is estimated that between 1995 and 2007 27% of labour productivity growth in the United States was explained by investments in KBC. Across Europe, investment in KBC accounts for 20 to 25% of average labour productivity growth. And research indicates that Canada’s GDP and labour productivity growth would have been 0.2 percentage points higher between 1976 and 2000 if previously excluded KBC were included in the national accounts as investments.
Estimates for the 27 EU countries show that once business’ spending on KBC is treated as investment, measured labour productivity growth increases in all countries. In national accounts, treating KBC as investment, rather than intermediate expenditure, generally increases the contribution to overall growth coming from capital deepening (i.e.
from a greater use in production of the capital represented by KBC).
However, much work still needs to be done on how much KBC contributes to growth:
Growth accounting, however, does not explain the causal determinants of growth. Nor does it explain the complementarities between those determinants. Econometric methods are needed to tackle this challenge. Considering human capital and R+D – two forms of KBC – research has established their positive and significant impacts on macro-level productivity and growth. For instance, raising average educational attainment by one year has been estimated to increase aggregate productivity by at least 5%. R+D not only enlarges the technological frontier, it also enhances firms’ technological absorptive capacity. Micro-econometric studies often find private rates of return to R+D in the range of 20-30%. This is generally higher than the returns to physical capital, which is consistent with the higher risk associated with KBC. And the spill-over effects of R+D, while hard to measure precisely, are usually found to be large.
Empirical evidence of KBC-based growth
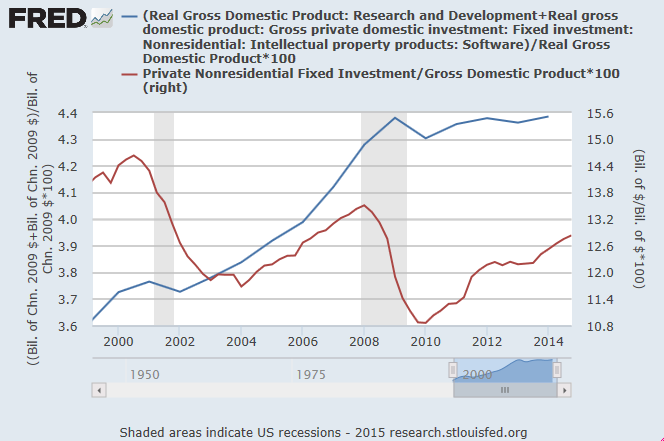
Indeed, there is some empirical evidence that KBC, or intellectual property, is becoming more important. The FRED graph below depicts R+D and software as a % GDP (blue line) and Private Nonresidential Fixed Investment, or CapEx, as a % of GDP (red line). Notwithstanding the different scales, the chart shows that while CapEx tanked in the wake of the last recession and has not recovered, investment in intellectual capital has been flat during the same period.

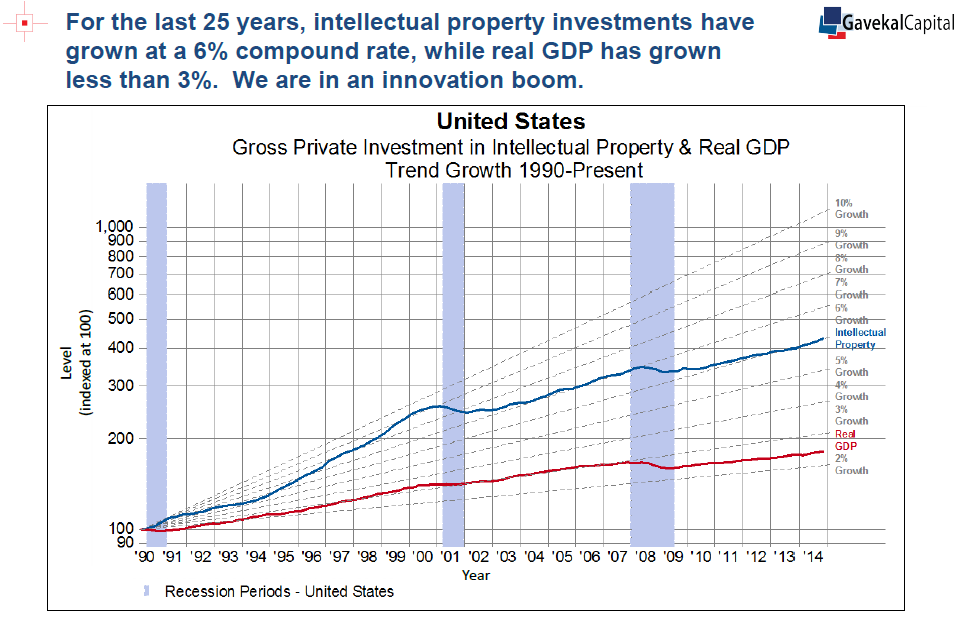
Further, Gavekal has a fund based on investing in what they call "Knowledge Leaders" which is built on the idea that the world is undergoing an innovation boom.

The latest update indicates that fund has outperformed its benchmark. Note that this post is not an endorsement of their fund or strategy. Gavekal states that they use a quantitative process to identify "Knowledge Leaders". The history of performance may be due to other transient factors, such as sector and industry tilts - do your own due diligence.
Nevertheless, these results from FRED and Gavekal present a possible explanation that the returns to intellectual property, which is intangible, is higher than the returns to tangible property, which is measured by traditional accounting techniques. This proposition is a propos in a week when the market has focused on the earnings reports of companies like Apple (NASDAQ:AAPL) and Twitter (NYSE:TWTR).
Disclosure: Cam Hui is a portfolio manager at Qwest Investment Fund Management Ltd. ("Qwest"). This article is prepared by Mr. Hui as an outside business activity. As such, Qwest does not review or approve materials presented herein. The opinions and any recommendations expressed in this blog are those of the author and do not reflect the opinions or recommendations of Qwest.
None of the information or opinions expressed in this blog constitutes a solicitation for the purchase or sale of any security or other instrument. Nothing in this article constitutes investment advice and any recommendations that may be contained herein have not been based upon a consideration of the investment objectives, financial situation or particular needs of any specific recipient. Any purchase or sale activity in any securities or other instrument should be based upon your own analysis and conclusions. Past performance is not indicative of future results. Either Qwest or Mr. Hui may hold or control long or short positions in the securities or instruments mentioned.
