Before I mention anything about the Gold charts, let me first address those among you who will remind me in a month or so if the analysis herein is incorrect. In fact, you will remind me … and remind me … and remind me.
I am a chartist. I do not believe that charts are predictive. Charts are a tool, that’s it. I lose money on more than 55% of my trades. That means that my default assumption on each trade is that I will lose money. So, if I am wrong on this post, big deal.
Charts offer me the opportunity to identify several things about a candidate trade:
- Path of least resistance for a market
- A logical place for entering a trade
- The price level where I will throw in the towel if I am wrong (I normally limit the risk on any given trade to 1% of my trading capital)
- A possible price target or objective
More importantly — and you will not understand this point if you are a professional wannabe — certain price behavior and its resulting chart structure can provide insight into trade with extremely torqued reward to risk profiles. And this — in my opinion — is the real value of charting. So if I am wrong on a call — go whine to your psychologist! Maybe he (or she) will care.
One final point. While I give Silver bulls a hard time (they deserve it), I really do not care whether Silver and Gold go up or down. It does not matter to me. I just want to be on the right side of the move when it comes.
OK, onto the Gold charts. For a starter, please see the following post:The History of Gold Charts.
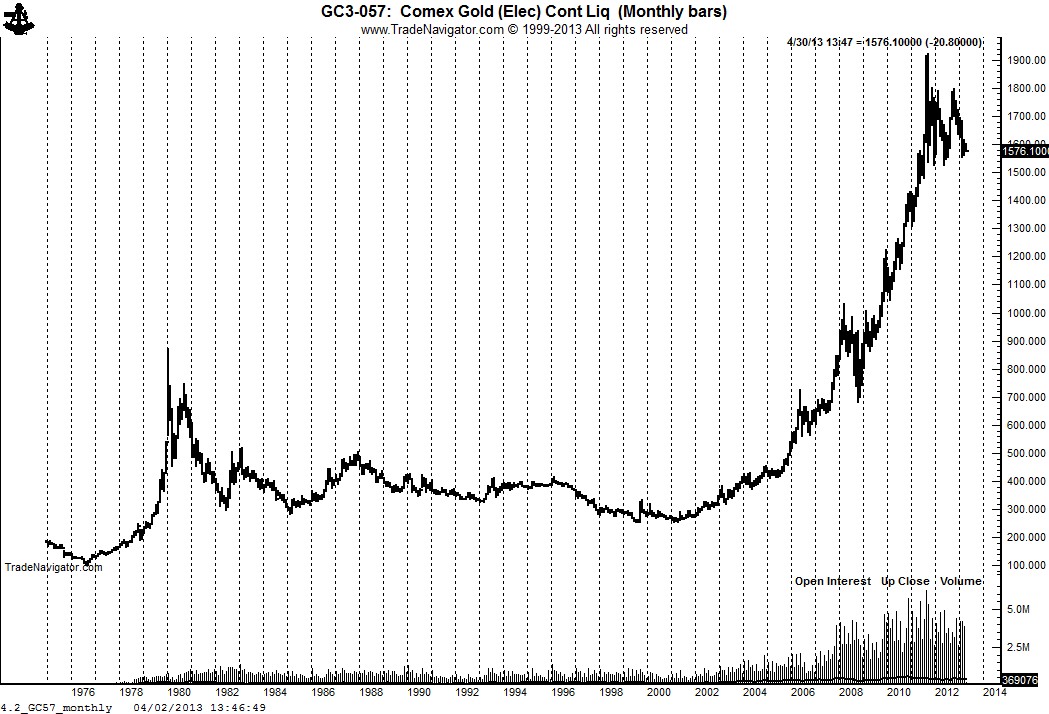
The monthly graph clearly shows the power of the bull market in Gold since 2002. This has been one grand advance.
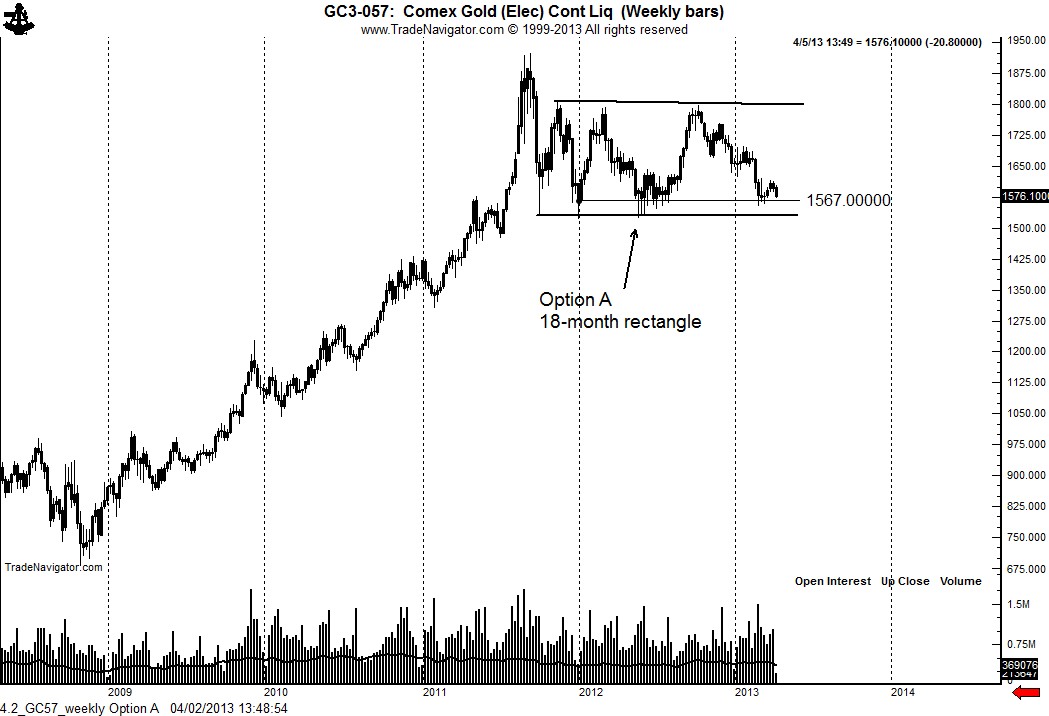
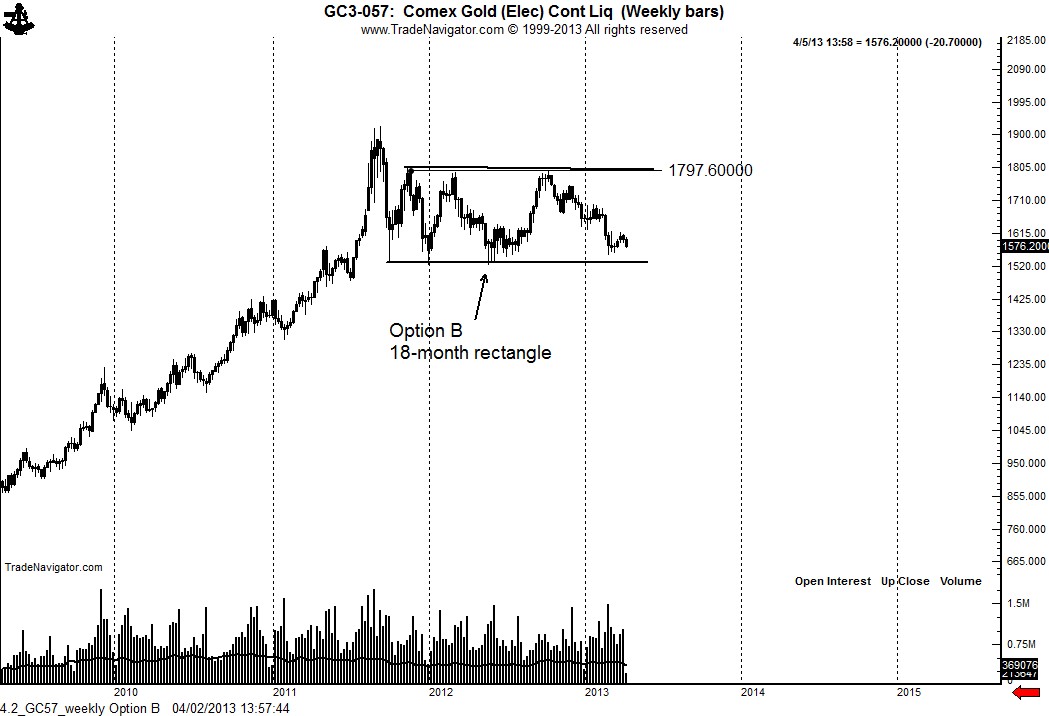
I believe that the sideways action in Gold since the September 2011 high will be resolved by a massive advance or decline. I can read this 18-month congestion in one of two ways.
Option A is that the weekly Gold chart is forming a rectangle top pattern — and that a daily close below 1510 or weekly close below 1550 will trigger a substantial decline.
Option B is that the weekly Gold chart is forming a continuation rectangle — and that a close above 1800 will trigger a substantial advance.
I know that my “either or” scenarios drive you Silver bulls crazy. So, go whine to your psychologist!
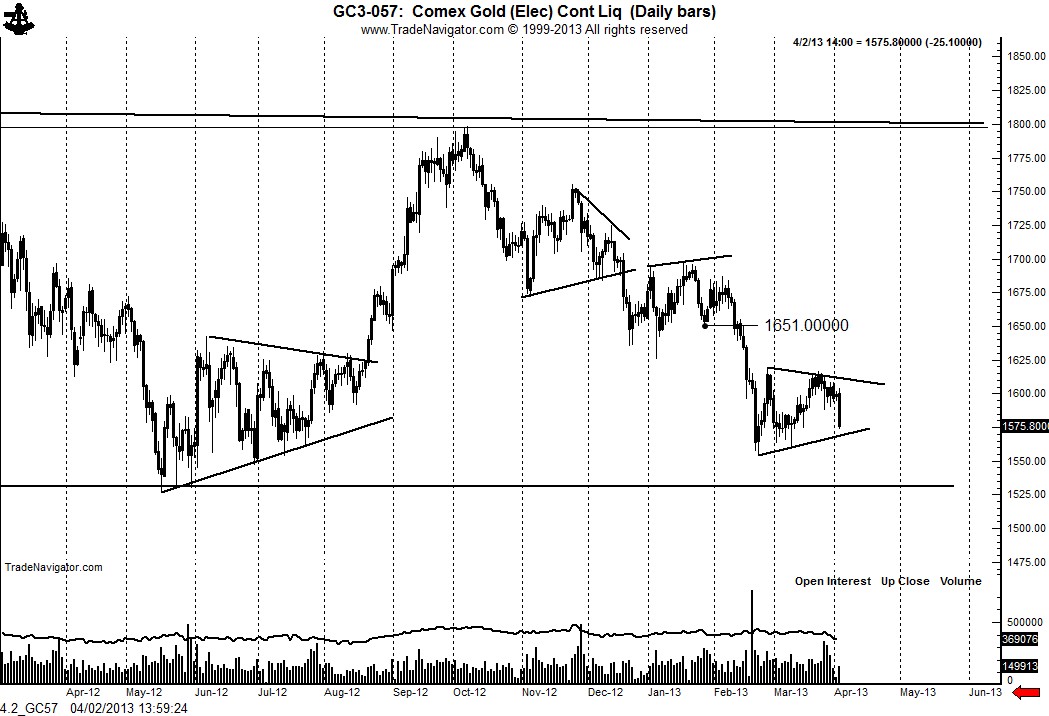
The daily chart is where it gets interesting. Often times, a move out of a massive pattern gets launched from a small pattern. The daily chart appears to be forming a 6-week symmetrical triangle. While not substantial in and of itself, this triangle could be the fuse that lights the bigger pattern.
Stay tuned, boys and girls.
Disclaimer: I am short June Gold with a stop at 1602.1. I will pyramid this trade per the general thoughts presented herein.
