This year has been a roller-coaster for markets and the exchange traded funds that track them, with significant divergences in fortunes across sectors during the pandemic. Today, we review ETFs that were either clear winners or losers in 2020. Leveraged and inverse ETFs, however, have been excluded as they are typically more appropriate for experienced short-term traders.
We hope several of these funds can inspire readers to put together long-term diversified portfolios within their risk/return parameters.
Major Indices
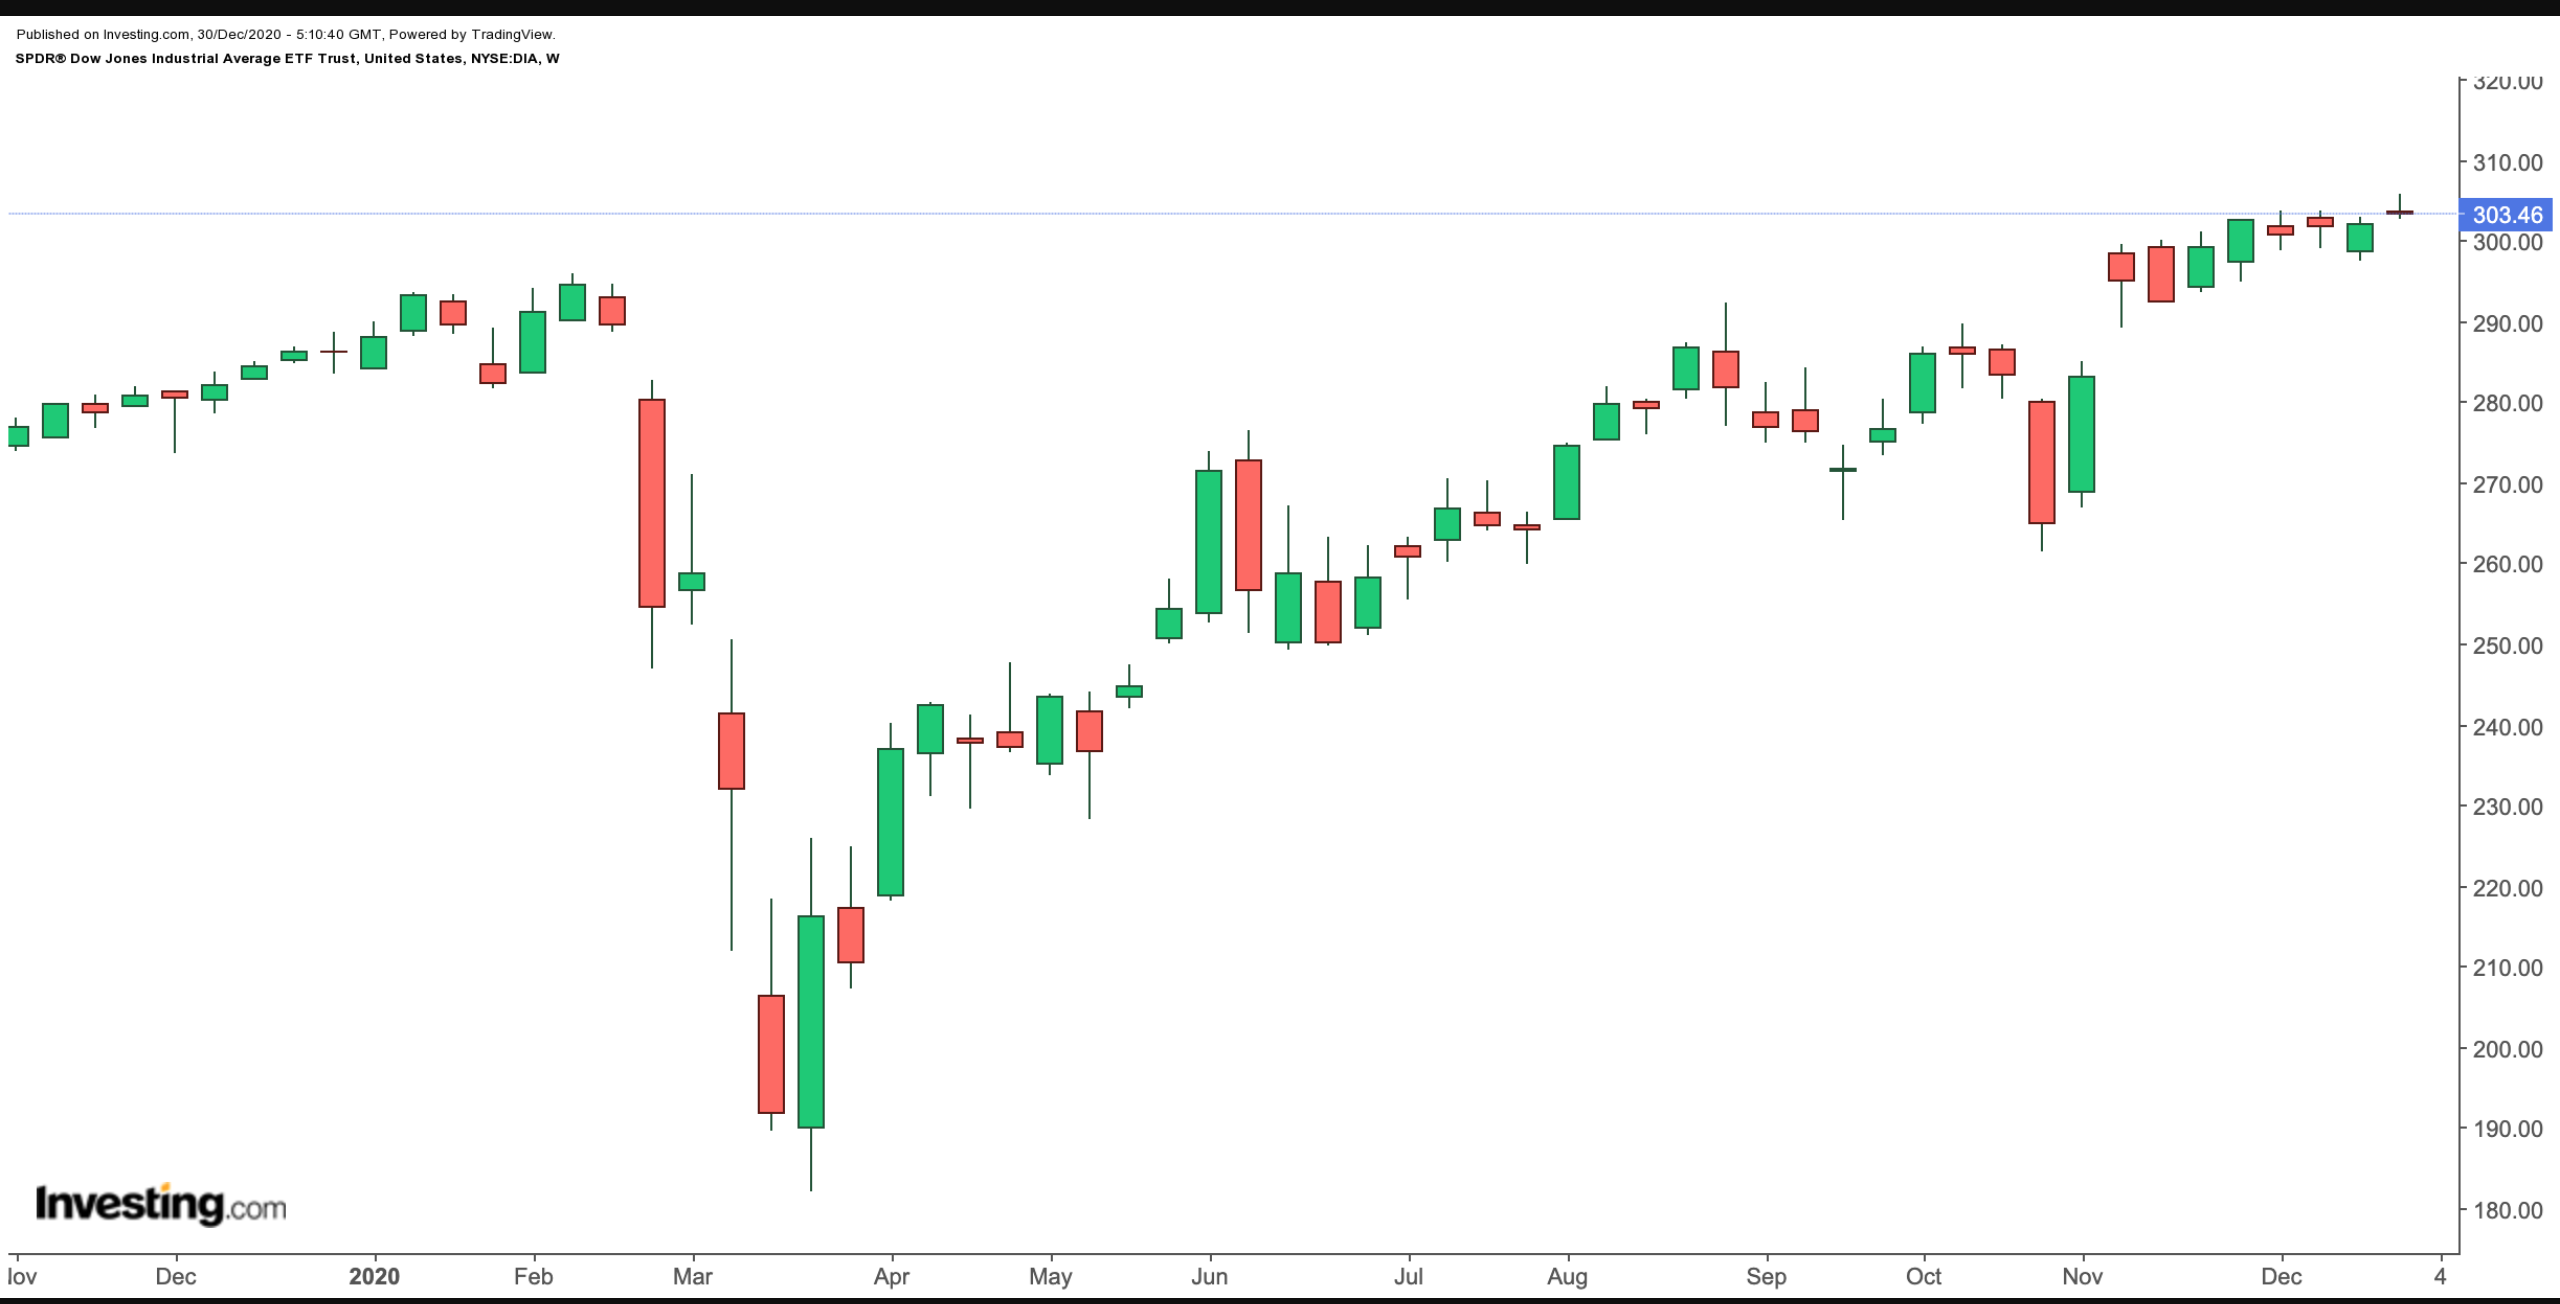
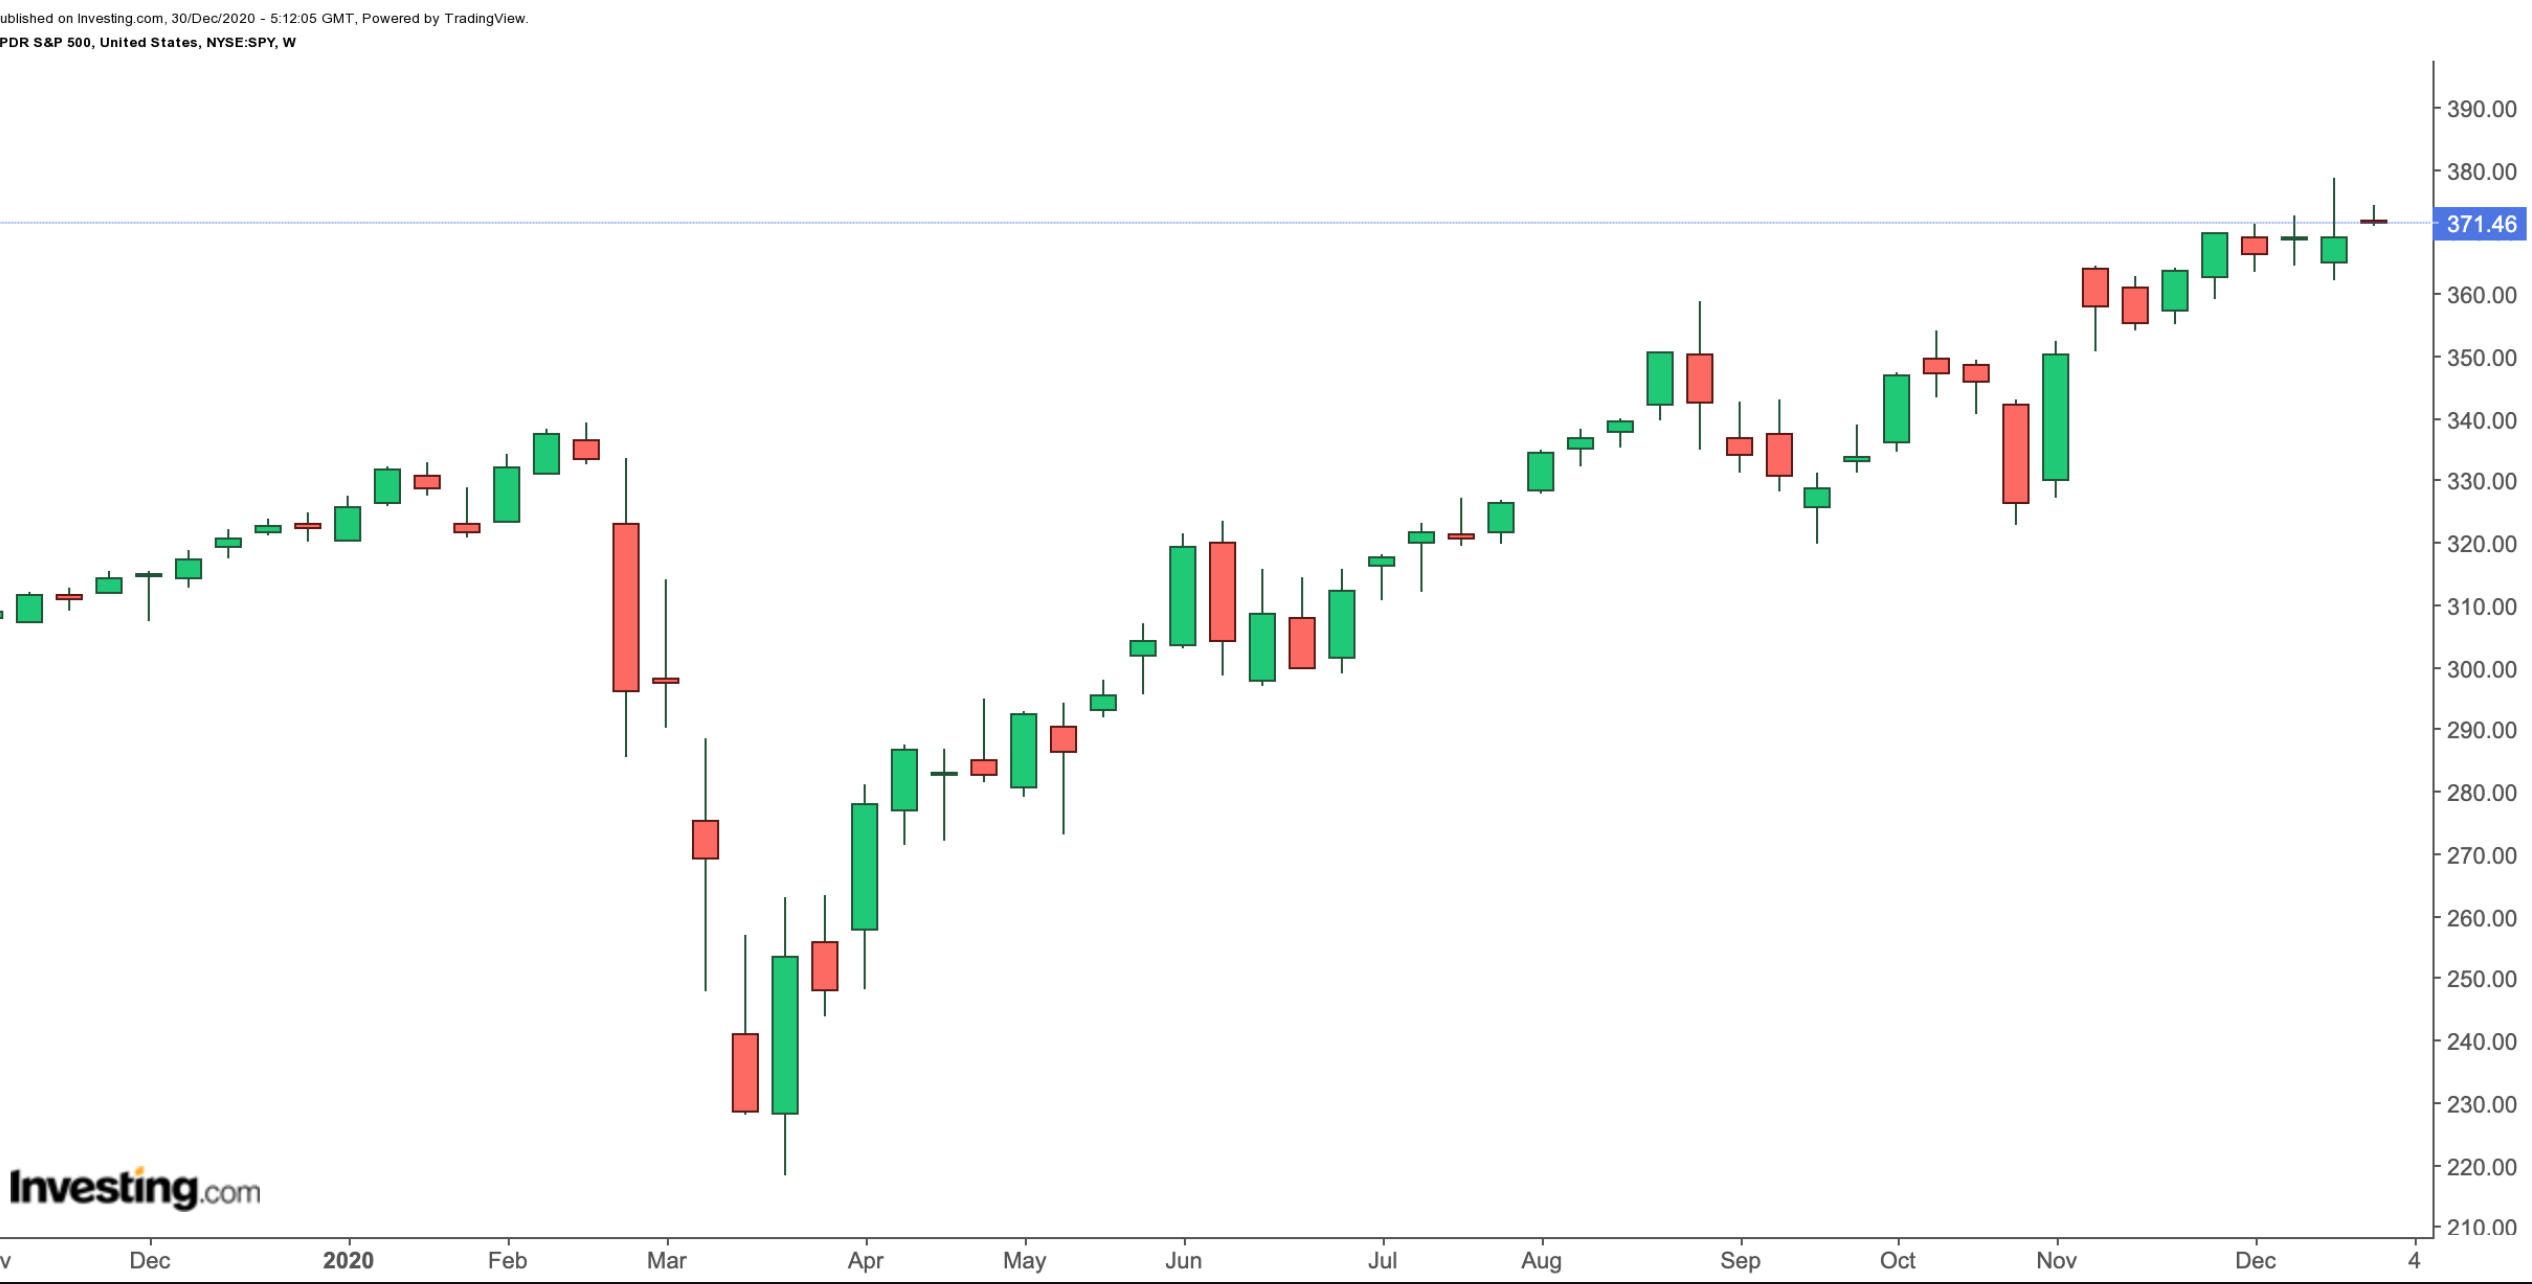
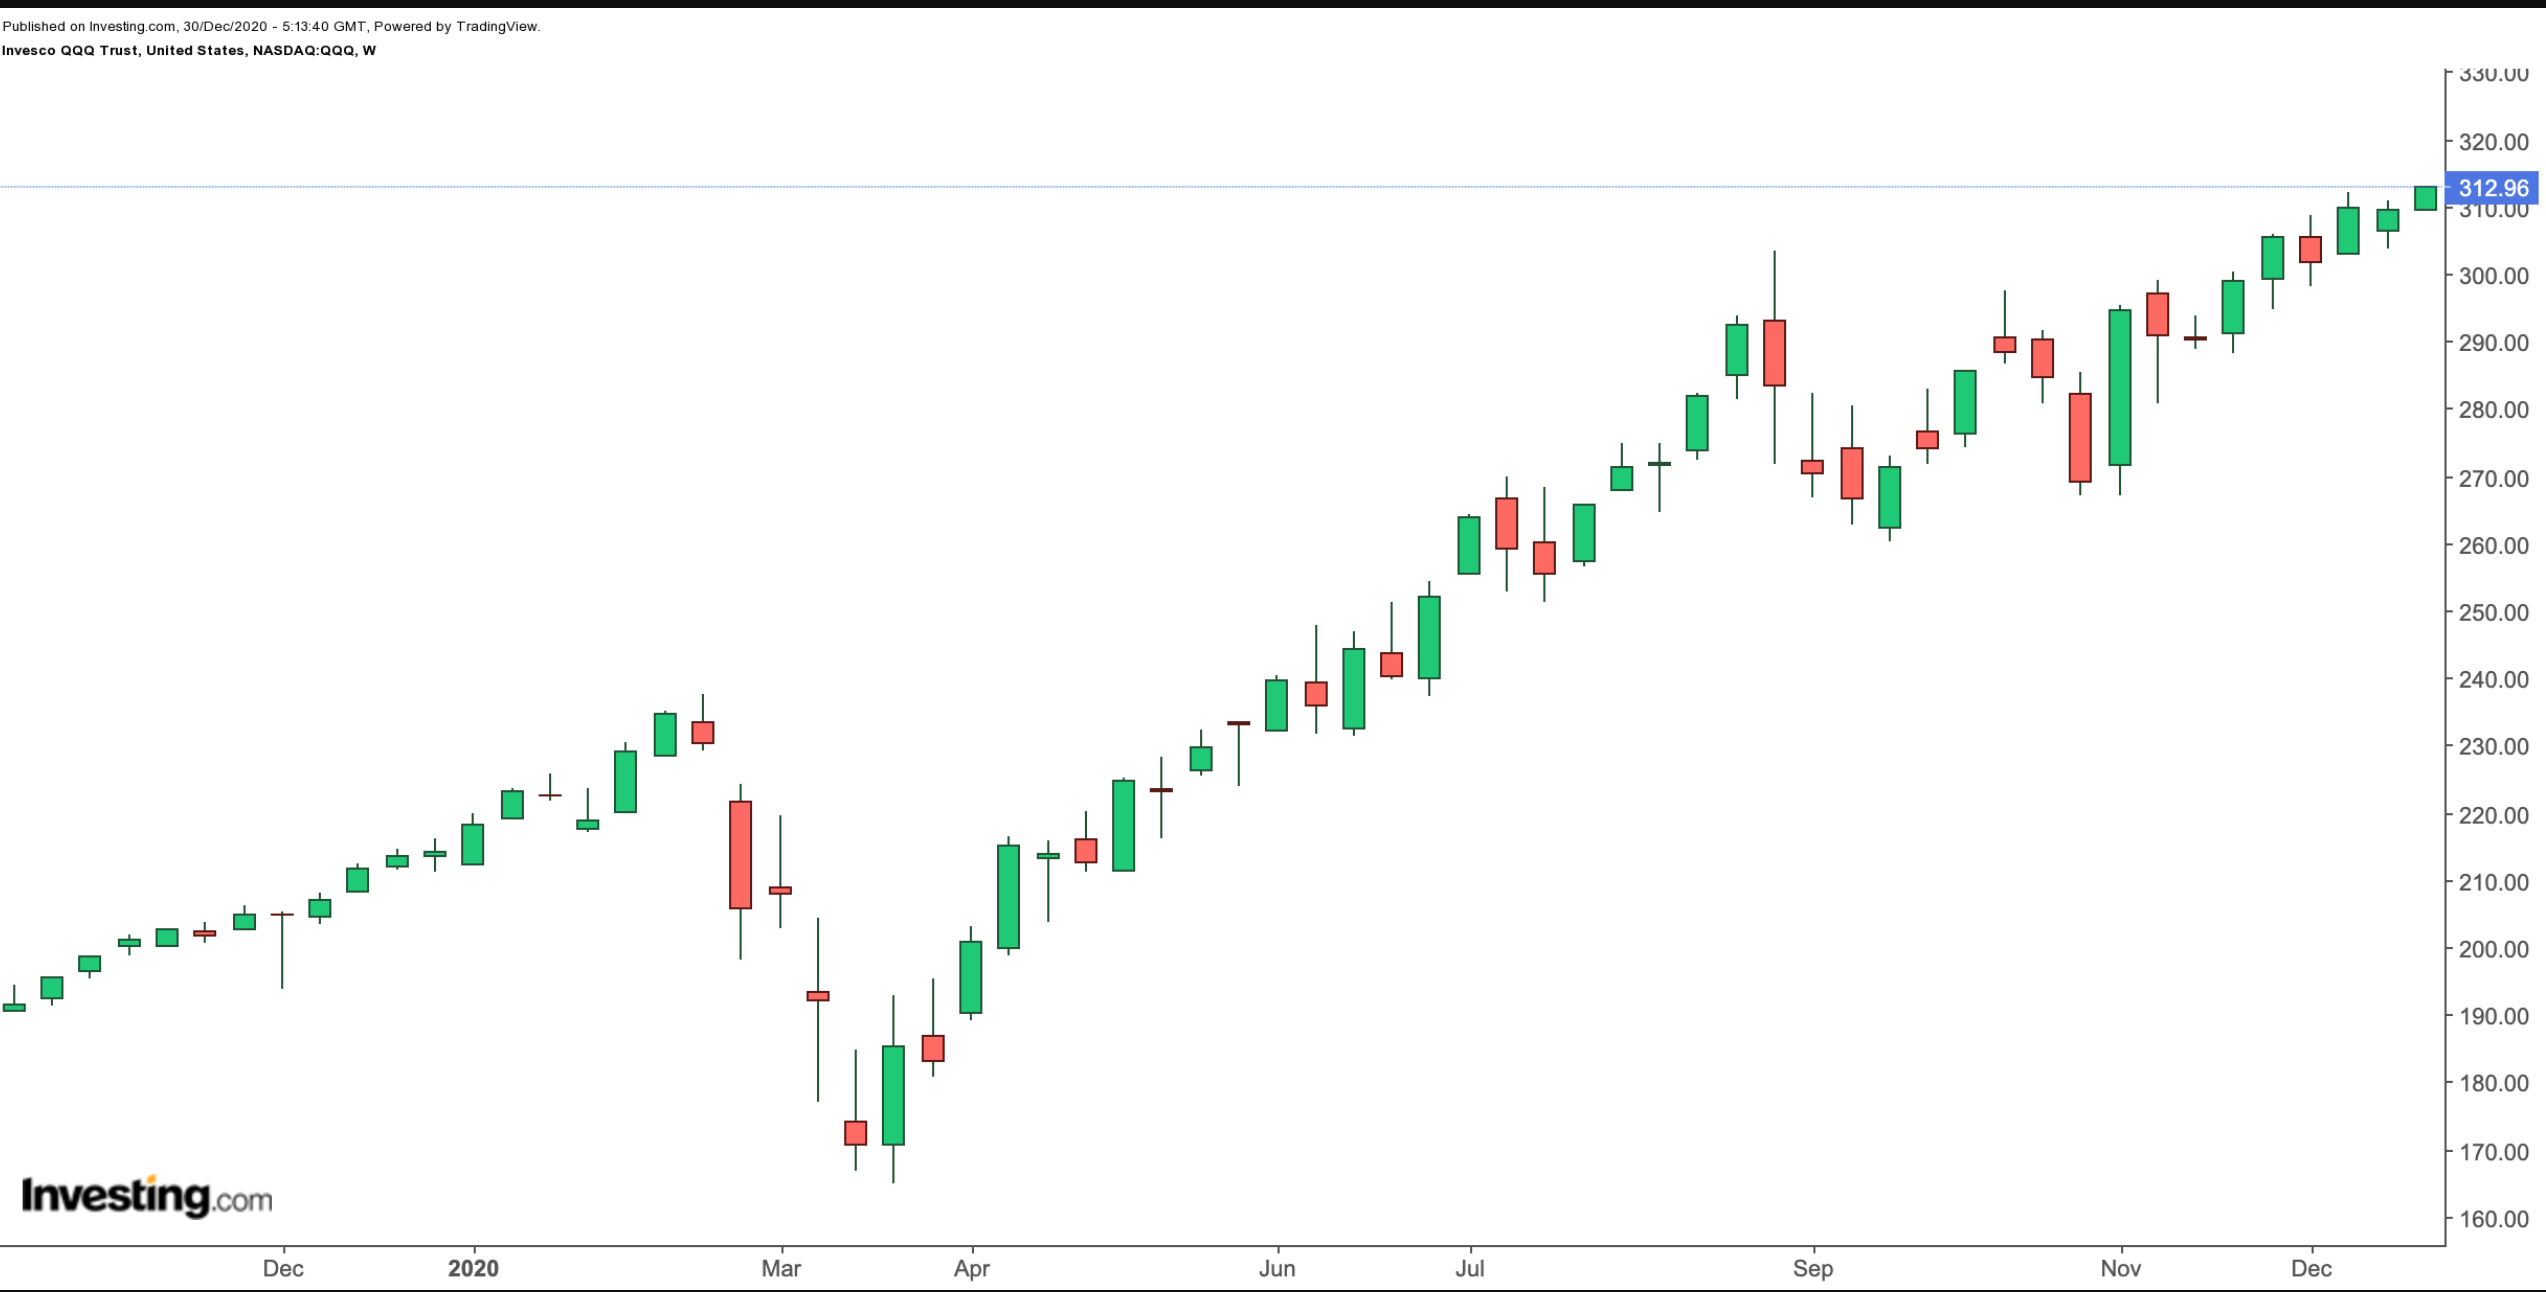
Main indices have not only fully recovered since their spring lows, but have returned double-digit gains year-to-date (YTD). Three names top the list:
SPDR® Dow Jones Industrial Average ETF Trust (NYSE:DIA), which tracks the Dow Jones Industrial Average — up 6.9% YTD (covered here)

SPDR S&P 500 (NYSE:SPY), which tracks the S&P 500 Index — up 15.8 % YTD (covered here)

Invesco QQQ Trust (NASDAQ:QQQ), which tracks the NASDAQ 100 index — up 47.1% YTD (covered here)

Clearly, tech shares and thus the tech-heavy ETF did better than broader market indices and funds.
With that, we'll look at several funds that provided profitable exposure to sub-sectors in technology in 2020.
Technology Winners
We believe any discussion on tech shares has to start with semiconductor stocks. Two ETFs with strong returns in that segment are:
- SPDR® S&P Semiconductor ETF (NYSE:XSD) — up 59.1% YTD (covered here)
- VanEck Vectors Semiconductor ETF (NYSE:SMH) — up 51.95% YTD
From there we'll move to funds with more distinct themes, like artificial intelligence (AI), autonomous driving, blockchain, clean energy technologies, cloud computing, communication services, cybersecurity, digitalization, e-commerce, e-sports, financial technology (fintech), 5G, innovation, machine learning, robotics, social media, software or work-from-home.
In those arenas we have the following funds (all listed in alphabetical order):
- ARK Fintech Innovation ETF (NYSE:ARKF) — up 105.7% YTD
- ARK Innovation ETF (NYSE:ARKK) — up 159.3% YTD (covered here)
- Amplify Transformational Data Sharing (NYSE:BLOK) — up 84.8% YTD (covered here)
- BlueStar Israel Technology ETF (NYSE:ITEQ) — up 60.1% YTD
- Defiance 5G Next Gen Connectivity ETF (NYSE:FIVG) — up 28.1% YTD (covered here)
- Direxion Work From Home ETF (NYSE:WFH) — up 52.3% since late July when it began trading (covered here)
- Global X Cloud Computing (NASDAQ:CLOU) — up 78.8% YTD (covered here)
- Global X Lithium & Battery Tech ETF (NYSE:LIT) — up 122.4% YTD
- Innovator Loup Frontier Tech (NYSE:LOUP) — up 84.6% YTD
- Invesco DWA Technology Momentum ETF (NASDAQ:PTF) — up 83.6% YTD
- iShares Cybersecurity and Tech ETF (NYSE:IHAK) — up 52.3% YTD (covered here)
- iShares Global Clean Energy ETF (NASDAQ:ICLN) — up 137.8% YTD (covered here)
- KraneShares Electric Vehicles and Future Mobility Index (NYSE:KARS) — up 67.8% YTD
- O'Shares Global Internet Giants (NYSE:OGIG) — up 105.3% YTD
- ProShares Long Online Short Stores (NYSE:CLIX) — up 89.2% YTD
- SPDR® FactSet Innovative Technology ETF (NYSE:XITK) — up 31.7% YTD
- VanEck Vectors Video Gaming and eSports ETF (NYSE:ESPO) — up 31.7% YTD (covered here)
- Vanguard Information Technology Index Fund ETF Shares (NYSE:VGT) — up 45.2% YTD
- WisdomTree Growth Leaders Fund (NYSE:PLAT) — up 58.9% YTD
Other Winners
But 2020 was not all about technology. Here are several other exchange-traded funds that have returned double-digit or greater gains since the start of the year:
- ARK Genomic Revolution ETF (NYSE:ARKG) — up 203.1% YTD
- Global X MSCI China Consumer Disc ETF (NYSE:CHIQ) — up 31.7% YTD (covered here)
- iShares MSCI India ETF (NYSE:INDA) — up 13.1% YTD (covered here)
- iShares Nasdaq Biotechnology ETF (NASDAQ:IBB) — up 27.5% YTD (covered here)
- iShares Silver Trust (NYSE:SLV) — up 46.5% YTD (covered here)
- Kraneshares MSCI China Environment (NYSE:KGRN) — up 133.6% YTD
- Robo Global® Healthcare Technology and Innovation ETF (NYSE:HTEC) — up 66.4% YTD (covered here)
- SPDR Gold Shares (NYSE:GLD) — up 22.9% YTD (covered here)
- SPDR® S&P Homebuilders ETF (NYSE:XHB) — up 28.4% YTD (covered here)
- Vanguard Materials Index Fund ETF Shares (NYSE:VAW) — up 15.5% YTD (covered here)
- Vanguard Consumer Discretionary Index Fund ETF Shares (NYSE:VCR) — up 44.9% YTD
Losers: ETFs That Had A Tough 2020
Volatility during the year has once again shown the importance of having a diversified portfolio. Although many sectors have recovered from their spring-lows, a significant number of funds are still down for the year.
Contrarian investors who expect a rotation into some of these segments in 2021 may want to research them further. We previously covered several ETFs that could see a positive trend in the coming months. Here are a number of ETFs that have not had positive returns in 2020:
- Alerian MLP ETF (NYSE:AMLP) — down 39.4% YTD
- Arrow Dow Jones Global Yield ETF (NYSE:GYLD) — down 17.8% YTD
- Breakwave Dry Bulk Shipping (NYSE:BDRY) — down 50.8% YTD
- Financial Select Sector SPDR® Fund (NYSE:XLF) — down 5.5% YTD (covered here)
- First Trust Latin America AlphaDEX® Fund (NASDAQ:FLN) — down 15.2% YTD
- First Trust Natural Gas ETF (NYSE:FCG) — down 50.8% YTD
- Invesco DB US Dollar Index Bullish Fund (NYSE:UUP) — down 6.2% YTD (covered here)
- Invesco Dynamic Leisure and Entertainment ETF (NYSE:PEJ) — down 12.1% YTD (covered here)
- Invesco KBW Premium Yield Equity REIT ETF (NASDAQ:KBWY) — down 33.3% YTD
- iShares Edge MSCI Intl Value Factor ETF (NYSE:IVLU) — down 6.4% YTD (covered here)
- iShares MSCI United Kingdom ETF (NYSE:EWU) — down 13.8% YTD (covered here)
- iShares North American Natural Resources ETF (NYSE:IGE) — down 23.1% YTD
- The Real Estate Select Sector SPDR Fund (NYSE:XLRE) — down 6.4% YTD (covered here)
- SPDR® S&P Insurance ETF (NYSE:KIE) — down 6.4% YTD (covered here)
- U.S. Global Jets ETF (NYSE:JETS) — down 29.1% YTD (covered here)
- Utilities Select Sector SPDR® Fund (NYSE:XLU) — down 4.8% YTD (covered here)
- Vanguard Energy Index Fund ETF Shares (NYSE:VDE) — down 36.5% YTD
- Vanguard Financials Index Fund ETF Shares (NYSE:VFH) — down 5.7% YTD
