The big banks have been see-sawing this week after a relief bump from Citigroup's (NYSE:C) earnings beat on Monday, followed by a pullback in pre-market trading Tuesday morning after JPMorgan (NYSE:JPM) missed earnings estimates for the first time in 15 quarters. The next round of reports is coming up with Bank of America (NYSE:BAC) and Goldman Sachs (NYSE:GS) scheduled to report earnings before markets open on Wednesday, Jan. 16 and Morgan Stanley (NYSE:MS) the following morning on Thursday, Jan. 17.
Over the past several months, analysts have increasingly lowered earnings estimates and grown bearish about the big banks for a number of reasons. One of them has been trading divisions, which have been widely expected to weigh on this quarter’s results due to lackluster fixed income results. That’s been seen in earnings reports so far and is widely expected to show up in the reports from GS and MS due to the size of their trading operations Where a potential negative surprise could come in for those companies is if equities trading ends up being weaker than expected.
Another reason is growing economic and geopolitical uncertainty, generally a recipe for muted loan growth and unpredictable market activity (equity and debt underwriting, mergers and acquisitions, etc.) Even though growth has still been strong in many global economies, analysts have grown increasingly worried about how long that will last and how quickly a slowdown might come.
And while rising interest rates are typically beneficial for banks, analysts have indicated that they see the banks needing to start offering higher rates to customers on their deposits to be able to retain them as banks become more aggressive in attracting new customers.
Bank Of America Earnings And Options Activity
BAC is expected to report EPS of $0.63, up from $0.48 in the prior-year quarter, on revenue of $22.45 billion, according to third-party consensus analyst estimates. Revenue is projected to increase 4% year over year. Those EPS estimates have come down about two cents over the past few months as analysts increasingly expected lower results from the bank’s trading business, specifically fixed income.
Like the other banks, BAC’s trading has seen inconsistent results in recent quarters. In Q3, BAC reported $3.1 billion in sales and trading revenue in its global markets segment, down 3% year-over-year (YoY), driven by fixed income, currency and commodity (FICC) trading dropping 5% to $2.1 billion. The results weren’t all bad in that division as equities revenue was up 3% to $1 billion.
That segment is still a smaller portion of BAC’s business, and analysts are likely to hone in on the consumer banking division, by far its largest. In Q3, the bank reported that loans were up 6% YoY to $285 billion and deposits had increased 4% to $688 billion. Net income in that division greatly outpaced revenue growth in Q3, and was up 49% YoY to $3.1 billion.

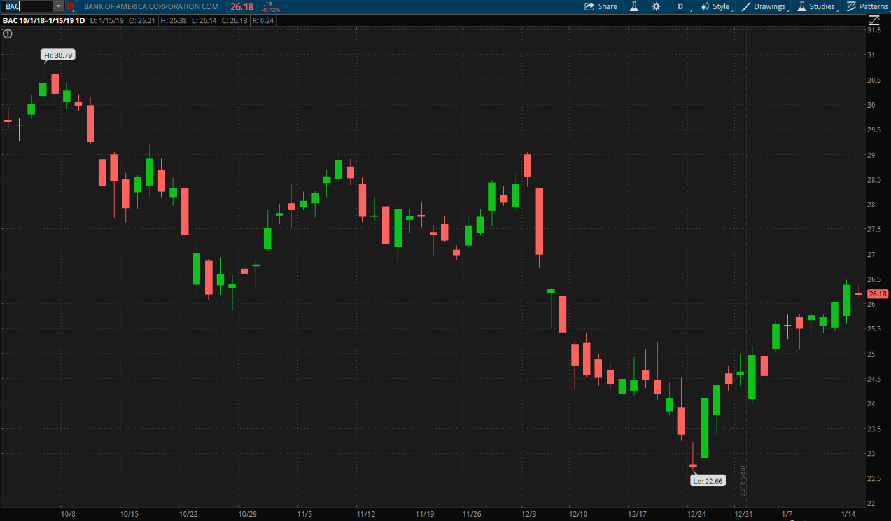
Still in a Downtrend. Shares of BAC have bounced back a ways from their December low of $22.66, the stock is butting up against the upper range of its downtrend over the past few months. Chart source: thinkorswim® by TD Ameritrade. Not a recommendation. For illustrative purposes only. Past performance does not guarantee future results.
Around BAC’s earnings release, options traders have priced in a 2.8% ($0.73) stock move in either direction, according to the Market Maker Move indicator on the thinkorswim® platform. Implied volatility was at the 45th percentile, as of this morning.
In recent trading at the Jan. 18 monthly expiration, volume has been heaviest on the call side between the 26 strike price up to the 27.5 strike price. For puts, trading has been concentrated at the 25 strike, with higher volume at the 24 and 24.5 strikes as well.
At the Feb. 15 monthly expiration, trading on the call side has mostly been concentrated from the 26 strike up to the 30 strike. Volume on the put side has been much lighter relative to calls, and there has just been a smattering of activity around the money.
Note: Call options represent the right, but not the obligation, to buy the underlying security at a predetermined price over a set period of time. Put options represent the right, but not the obligation to sell the underlying security at a predetermined price over a set period of time.
Goldman Sachs Earnings And Options Activity
GS is expected to report EPS of $5.61 on revenue of $7.78 billion, according to third-party consensus analyst estimates. Expectations for this quarter are pretty much in line with last year’s $5.68 in EPS and $7.83 billion in revenue.
CEO David Solomon just took over in October 2018 and has faced some challenges right off the bat. Where analysts have a lot of questions is how the ongoing probe into the bank’s connection to 1MDB, a Malaysian state investment fund, is going to impact the company. Malaysia has filed criminal charges against GS units and former employees, and is seeking $7.5 billion in compensation. Some analysts have modeled the ordeal costing the company around $4 billion to $5 billion, with the potential for added fines in the U.S.
Beyond the 1MDB issues, the company’s operations will naturally be a focus for analysts. In Q3, revenue in the institutional client services division, which includes FICC trading and equities, came in flat to last year and 13% lower than Q2. FICC trading declined 10% to $1.31 billion, offsetting the equities segment’s 8% rise to $1.79 billion. Again, analysts are widely expecting similar weakness in FICC trading. Because of the size of GS’ trading operations, a bigger miss in FICC trading could have a larger impact on the company, which could be exacerbated if equities trading ends up below expectations.
GS’ greatest growth in Q3 came from investment banking and investment management divisions. The company reported that the former increased 10% YoY to $1.98 billion and the latter grew 12% YoY to $1.7 billion. The investing and lending division came in flat to last year with $1.86 billion in revenue.

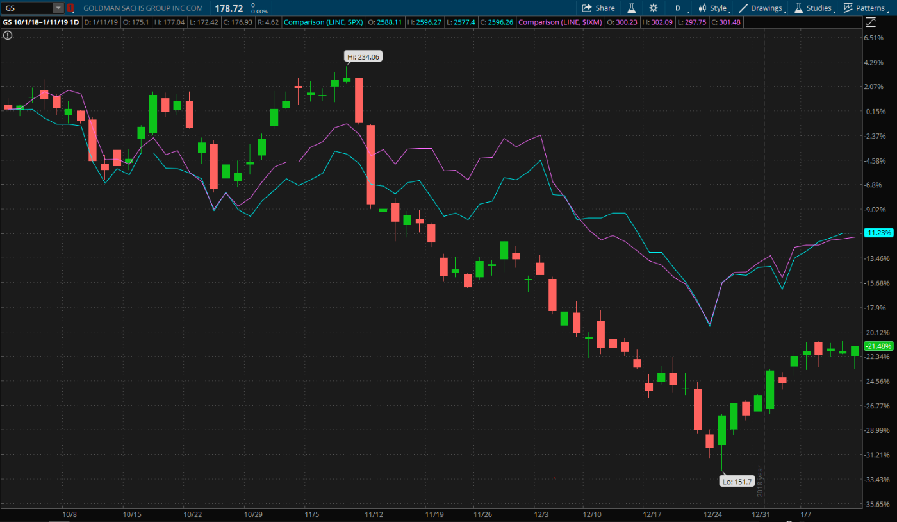
Harder Hit. Amid news of the 1MDB scandal, GS shares have been harder hit than the broader market. GS is charted above compared to the S&P 500 (SPX, teal line) and the S&P Financial Select Sector Index (IXM). Chart source: thinkorswim® by TD Ameritrade. Not a recommendation. For illustrative purposes only. Past performance does not guarantee future results.
For Q4, Morgan Stanley (NYSE:MS) is expected to report EPS of $0.92, up from $0.84 in the prior-year quarter, on revenue of $9.43 billion. Revenue is projected to come in just shy of last year’s $9.5 billion.
Similar to all the big banks this earnings season, analysts are widely expecting weakness from MS’ fixed income trading. In Q3, the company reported $1.2 billion in revenue for fixed income sales and trading, essentially flat to last year. Equity sales and trading, on the other hand, were up slightly to $2 billion. Many analysts are expecting a double-digit percentage decline from fixed income in Q4, with a low-single-digit rise in equities.
Since this division represents a sizable portion of MS’ operations, a large miss from fixed income trading could have an outsized impact on its results. And some analysts have expressed concerns that softness in fixed income trading could carry over to its equities operations.
Another area of analyst uncertainty as market volatility persists is the investment banking division. In Q3, MS reported equity underwriting revenue increased from $273 million a year ago to $441 million, and fixed income underwriting increased from $442 million to $508 million. At the same time, analysts are expecting advisory fees to get a boost from increased M&A activity.

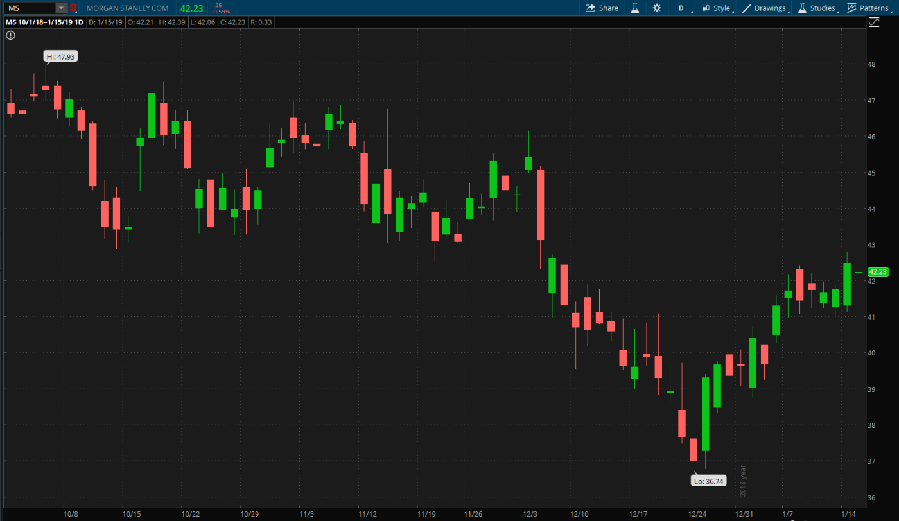
Top of the Downtrend. MS has risen in the past few sessions, but it is butting up against the top of a multi-month downtrend. Earnings might be the factor that determines if the stock breaks out, or continues in its current range. Chart source: thinkorswim® by TD Ameritrade. Not a recommendation. For illustrative purposes only. Past performance does not guarantee future results.
Around MS’ earnings release, options traders have priced a 3.5% ($1.50) stock move in either direction, according to the Market Maker Move indicator. Implied volatility was at the 48th percentile as of this morning.
In short-term trading at the Jan. 18 monthly expiration, calls have been active at the 42 and 43 strike prices. Puts have seen a lot of activity ranging from the 42 strike down to the 40 strike. Further out at the Feb. 15 monthly expiration, calls have been active at the 42 strike, whereas activity on the put side has been spread out, mostly right around the money.
TD Ameritrade® commentary for educational purposes only. Member SIPC. Options involve risks and are not suitable for all investors. Please read Characteristics and Risks of Standardized Options.
