Our last article, “Market Correlations & Hedging Strategies”, covered some ETFs that have an inverse correlation to the market, and have been beating the S&P 500 handily over the past several months.
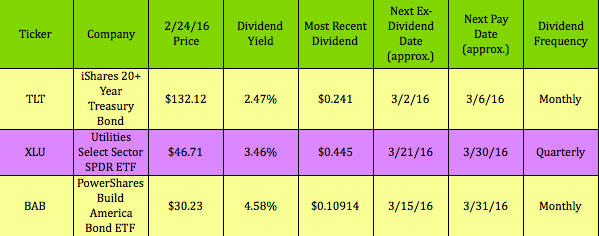
This article goes one step further – how’d you like to find some ETFs that are not only good market hedges, but also pay dividends? We found 3 such vehicles – they may not be high dividend stocks, but 2 out of 3 pay monthly, and all 3 go ex-dividend in March:
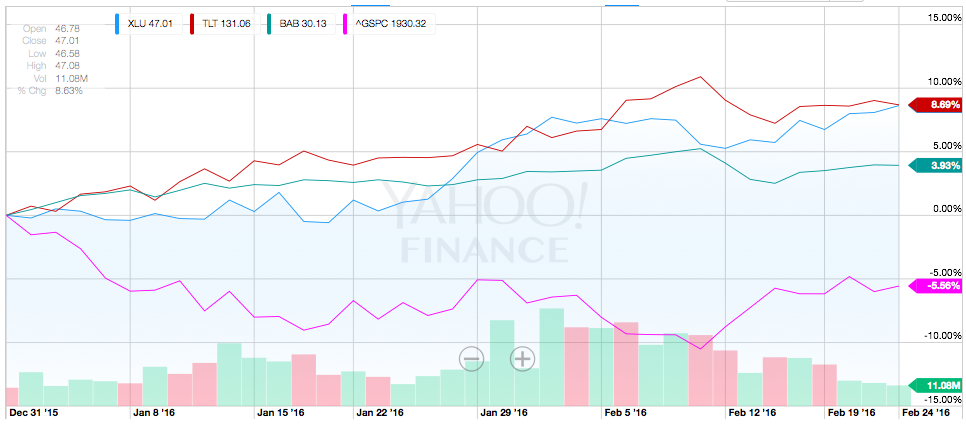
Performance: Over the past 5 years, these ETFs have all performed well…

…but things get real interesting when you look at their YTD 2016 performance vs. the S&P 500, which was down around -5.58% as we wrote this article.
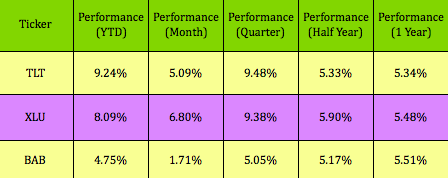
Here’s a look at performance for various recent time periods, all of which outperformed the S&P 500:
Options: We’ve tracked Covered Call trades for N:TLT in our Covered Calls Tables for several years. This April $133.00 call strike pays $2.12, with an annualized yield of 13.88%.

Selling Puts: The April $131.00 TLT put strike pays $.2.70, and gives you a breakeven of $128.30.

Profiles:
TLT: The iShares 20+ Year Treasury Bond (N:TLT) ETF seeks to track the investment results of an index composed of U.S. Treasury bonds with remaining maturities greater than twenty years.
N:XLU: The Utilities Select Spider ETF seeks to provide investment results that, before expenses, correspond generally to the price and yield performance of publicly traded equity securities of companies in the Utilities Select Sector Index. In seeking to track the performance of the index, the fund employs a replication strategy. It generally invests substantially all, but at least 95%, of its total assets in the securities comprising the index. The index includes companies from the following industries: electric utilities; multi-utilities; independent power producers and energy traders; and gas utilities.
N:BAB: The PowerShares Build America Bond Portfolio (Fund) is based on The BofA Merrill Lynch Build America Bond Index (Index).
The Fund will normally invest at least 80% of its total assets in the securities that comprise the Index. The Index is designed to track the performance of US dollar-denominated Build America Bonds publicly issued by US states and territories, and their political subdivisions, in the US market. The Fund and the Index are rebalanced and reconstituted monthly.
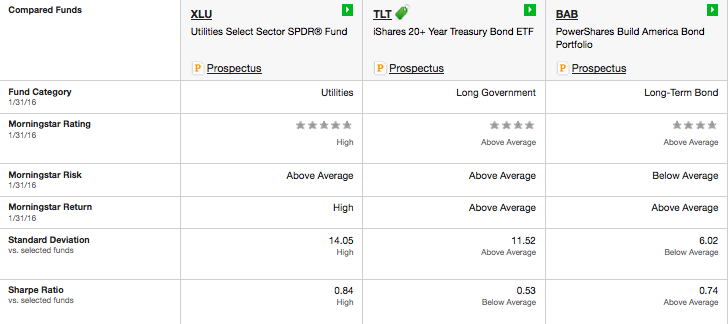
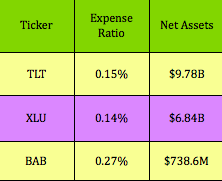
Expenses: All 3 of these ETFs have low expense ratios. TLT is the largest, with $9.7B in assets, dwarfing BAB, which has $763.6M in assets.
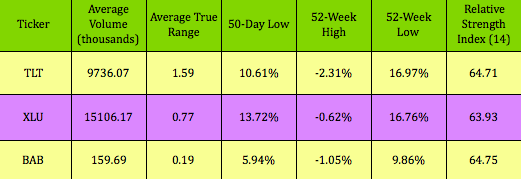
Technicals: XLU and TLT have much larger daily trading volume than BAB, which trades 159 thousand shares on average daily. All 3 have similar RSIs, and are trading near their 52-week highs.
Holdings:
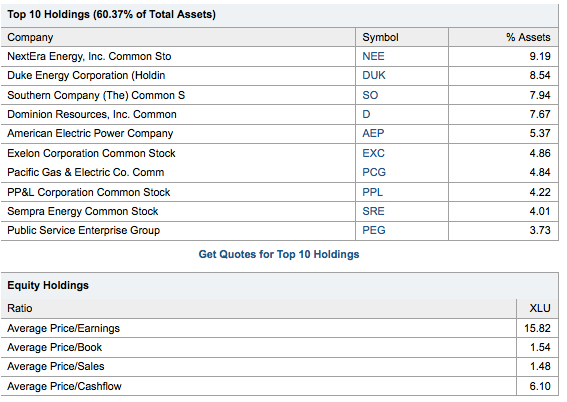
XLU’s top 10 holdings are some of the largest Utilities in N. America, and their average P/E of 15.82 is below the S&P’s trailing P/E of 21.82.
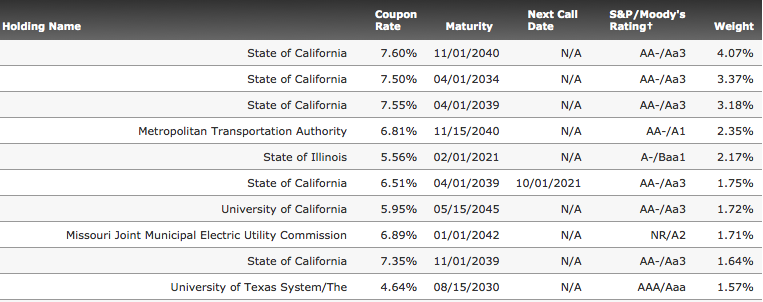
BAB’s top 10 holdings include mostly AA-rated state bonds, many from California, with maturities from 2021 out to 2045. These coupon rates are pretty high, ranging from 4.64%, up to 7.60%.
Disclosure: Author owned no shares of any ETF mentioned in this article at the time of publishing.
Disclaimer: This article was written for informational purposes only and isn’t intended as investment advice. Please practice due diligence before investing in any investment vehicle mentioned in this article.
