
Denbury Resources Inc. (NYSE:DNR) reported fourth-quarter 2019 earnings (excluding one-time items) of 9 cents per share, beating the Zacks Consensus Estimate by a penny. However, the reported earnings were lower than 10 cents per share in the year-ago period.
Total revenues were $310.6 million, down from $338.4 million in the year-ago quarter. However, the top line was in line with the Zacks Consensus Estimate.
The better-than-expected earnings were supported by lower transportation and marketing, and lease operating expenses. The positives were partially offset by decline in commodity price realizations and production volumes.
Despite the earnings beat, the stock declined 5.6% yesterday, given a year-over-year decline in production guidance amid a weak oil-price environment.
Denbury Resources Inc. Price, Consensus and EPS Surprise
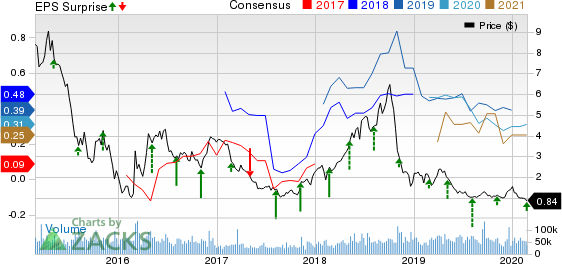
Denbury Resources Inc. price-consensus-eps-surprise-chart | Denbury Resources Inc. Quote
Proved Reserves
At the end of 2019, Denbury Resources’ total proved reserves were 230 million barrels of oil equivalent, of which 98% was liquids. This figure reflects a decline from the previous year.
Operational Performance:
Production Declines
During the quarter, production averaged 57,511 barrels of oil equivalent per day (Boe/d) compared with 59,867 Boe/d in the prior-year period. The decline stemmed from the divestment of Citronelle Field in mid-2019.
Oil production averaged 56,185 barrels per day (BPD), down from the year-ago level of 58,266 BPD. Natural gas daily production averaged 7,954 thousand cubic feet (Mcf/d), lower than the year-ago period’s 9,603 Mcf/d.
The company’s production from tertiary operations averaged 37,250 Boe/d, down from 37,764 Boe/d in the year-ago quarter.
Price Realizations Decline
Oil price realization (excluding the impact of hedges) averaged $56.58 per barrel in the quarter, decreasing from the year-ago level of $60.50. Gas prices declined to $1.89 per Mcf from $3.44 in the year-ago quarter. On an oil-equivalent basis, overall price realization was $55.53 per barrel, lower than the year-earlier level of $59.44.
Cost & Expenses
During the quarter, the company incurred lease operating expenses of $116 million, lower than the year-ago period’s $128.5 million, which can be attributed to reduced workover and CO2 costs. Expenses related to transportation and marketing fell to $9.7 million from the year-ago level of $12.3 million. However, total expenses in the reported quarter rose to $274.9 million from the year-ago level of $115.7 million, mainly owing to increased commodity derivative costs.
Capital Expenditure
Oil and natural gas capital investments were $46.7 million compared with $101.1 million in the year-ago quarter. Total capital spending (excluding capitalized interest and acquisitions) was $47.6 million, lower than $107.8 million in fourth-quarter 2018.
Financials
Adjusted cash flow from operations was $115.6 million, up from $65.4 million in the year-ago quarter. Notably, in 2019, the company recorded $165 million of free cash flow, the highest since 2015.
As of Dec 31, 2019, its cash balance was $516,000 and total debt was $2,281.7 million, with a debt-to-capitalization ratio of 61.8%.
Guidance
Denbury Resources expects to generate free cash flow of more than $100 million in 2020, assuming oil price to be $50 per barrel. The company anticipates its 2020 production guidance in the band of 53,000-56,000 Boe/d, adjusted for Gulf Coast divestments. Production was recorded at 56,900 Boe/d in 2019.
Base development capital expenditure view for 2020 is expected in the range of $174-$185 million, indicating a 25% decline from the 2019 level. Additionally, $140-$150 million capital will likely be allocated for Cedar Creek Anticline enhanced oil recovery development. The company has three significant tertiary projects, which are expected to come online within the third quarter.
Zacks Rank & Stocks to Consider
Denbury Resources currently carries a Zacks Rank #3 (Hold). Some better-ranked stocks in the energy sector include Marathon Oil Corporation (NYSE:MRO) , Chevron Corporation (NYSE:CVX) and Hess Corporation (NYSE:HES) , each carrying a Zacks Rank #2 (Buy). You can see the complete list of today’s Zacks #1 Rank (Strong Buy) stocks here.
Marathon Oil’s earnings per share estimates of 46 cents for 2020 have witnessed seven upward revisions and one downward movement in the past 60 days.
Chevron’s bottom line for 2020 is expected to rise 12.8% year over year.
Hess’ bottom line for 2020 is expected to rise 93.7% year over year.
Zacks Top 10 Stocks for 2020
In addition to the stocks discussed above, would you like to know about our 10 finest buy-and-hold tickers for the entirety of 2020?
Last year's 2019 Zacks Top 10 Stocks portfolio returned gains as high as +102.7%. Now a brand-new portfolio has been handpicked from over 4,000 companies covered by the Zacks Rank. Don’t miss your chance to get in on these long-term buys.
Access Zacks Top 10 Stocks for 2020 today >>
Marathon Oil Corporation (MRO): Free Stock Analysis Report
Chevron Corporation (CVX): Free Stock Analysis Report
Hess Corporation (HES): Free Stock Analysis Report
Denbury Resources Inc. (DNR): Free Stock Analysis Report
Original post
Zacks Investment Research