
ConocoPhillips Company (NYSE:COP) reported third-quarter 2019 adjusted earnings per share of 82 cents, beating the Zacks Consensus Estimate of 78 cents. However, the bottom line declined from the year-ago figure of $1.36 per share.
Based in Houston, TX, the world’s largest independent oil and gas producer’s quarterly revenues of $10,093 million decreased from third-quarter 2018 sales of $10,165 million. However, the figure beat the Zacks Consensus Estimate of $7,058 million.
The better-than-expected third-quarter 2019 results are primarily attributable to higher volumes from the company’s unconventional assets and lower expenses on purchased commodities. However, it was partially offset by lower realized commodity prices and higher exploration costs.
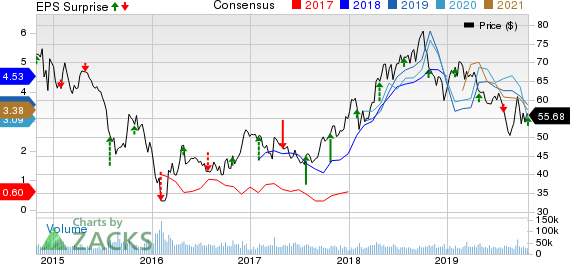
ConocoPhillips Price, Consensus and EPS Surprise
ConocoPhillips price-consensus-eps-surprise-chart | ConocoPhillips Quote
Production Growth
Total production averaged 1,366 thousand barrels of oil equivalent per day (MBoe/d), up 8.3% from the year-ago quarter’s 1,261 Mboe/d. ConocoPhillips’ production of crude oil came in at 710 thousand barrels per day (MBD), higher than the year-ago quarter’s 635 MBD.
The company’s production of natural gas liquids came in at 114 MBD, higher than the year-ago quarter’s 106 MBD. Bitumen production in the quarter was recorded at 63 MBD, marginally lower than the third-quarter 2018 figure of 65 MBD.
Natural gas output came in at 2,871 million cubic feet per day (MMcf/d), higher than the year-ago level of 2,732 MMcf/d. The overall production was aided by 21% year-over-year growth in the company’s Big 3 unconventional assets (Eagle Ford, Bakken and Delaware), alongside Alaska, Europe and Asia Pacific operations.
Realized Prices Decline
The average realized crude oil price during the third quarter was $59.57 per barrel, representing a decrease from the year-ago realization of $73.05. Realized natural gas liquids price was recorded at $15.59 per barrel, lower than the year-ago quarter’s $35.14. Average realized natural gas price during third-quarter 2019 was $4.74 per thousand cubic feet, down from the year-ago period’s $5.81. As such, average realized equivalent prices fell 18.4% to $47.07 per barrel from the year-ago level of $57.71.
Total Expenses Fall
ConocoPhillips’ third-quarter total expenses decreased to $6,600 million from $7,259 million in the corresponding period of 2018, owing to lower purchased commodities. Production and operating expenses fell to $1,331 million in the reported quarter from $1,367 million in the year-ago period. However, exploration costs rose to $360 million in third-quarter 2019 from $103 million in the comparable period of 2018.
Balance Sheet & Capital Spending
As of Sep 30, 2019, the oil giant — with a market capitalization of around $61.8 billion — had $7,193 million in total cash and cash equivalents. The company had a total long-term debt of nearly $14,799 million, representing a debt-to-capitalization ratio of 30%.
In the reported quarter, ConocoPhillips generated $2.3 billion in net cash from operating activities. Capital expenditures and investments totaled $1.7 billion, and dividend payments grossed $341 million. The company repurchased shares worth $749 million in the quarter.
Guidance
For fourth-quarter 2019, its production guidance is projected in the range of 1,265-1,305 MBoe/d, excluding Libya. The guidance incorporates the impacts from the divestment of U.K. assets, which generated proceeds of $2.2 billion. It has reiterated its guidance for all other metrics.
Zacks Rank and Stocks to Consider
Currently, ConocoPhillips has a Zacks Rank #5 (Strong Sell). Some better-ranked players in the energy space are Matrix Service Company (NASDAQ:MTRX) , Pembina Pipeline Corp. (NYSE:PBA) and Exterran Corporation (NYSE:EXTN) . While Matrix Service and Pembina sport a Zacks Rank #1 (Strong Buy), Exterran holds a Zacks Rank #2 (Buy). You can see the complete list of today’s Zacks #1 Rank stocks here.
Matrix Service’s 2019 earnings per share are expected to rise 58.4% year over year.
Pembina’s 2019 earnings per share are expected to rise 21.5% year over year.
Exterran’s top line for the current year is expected to rise around 5% year over year.
Breakout Biotech Stocks with Triple-Digit Profit Potential
The biotech sector is projected to surge beyond $775 billion by 2024 as scientists develop treatments for thousands of diseases. They’re also finding ways to edit the human genome to literally erase our vulnerability to these diseases.
Zacks has just released Century of Biology: 7 Biotech Stocks to Buy Right Now to help investors profit from 7 stocks poised for outperformance. Our recent biotech recommendations have produced gains of +98%, +119% and +164% in as little as 1 month. The stocks in this report could perform even better.
See these 7 breakthrough stocks now>>
Matrix Service Company (MTRX): Free Stock Analysis Report
Pembina Pipeline Corp. (PBA): Free Stock Analysis Report
ConocoPhillips (COP): Free Stock Analysis Report
Exterran Corporation (EXTN): Free Stock Analysis Report
Original post
Zacks Investment Research