
Annaly Capital Management, Inc. (NYSE:NLY) reported third-quarter 2019 core earnings, excluding premium amortization adjustment (PAA), of 21 cents per share, missing the Zacks Consensus Estimate of 25 cents. Moreover, the figure compares unfavorably with the year-ago tally of 30 cents.
Further, net interest income (NII) totaling roughly $152.4 million, witnessed a steep decline from the year-ago tally of $315.6 million.
Nonetheless, shares of the company inched up 0.6% in full-day trading session post earnings release, buoyed by broader market gains.
Moreover, the company managed to maintain a strong liquidity position, with unencumbered assets aggregating $7.2 billion in the September-end quarter.
Quarter in Detail
In the third quarter, average yield on interest-earning assets (excluding PAA) was 3.26%, up from the prior-year quarter’s 3.22%.
Net interest spread (excluding PAA) of 0.98% for the third quarter slid from 1.14% reported in the prior-year quarter. Net interest margin (excluding PAA) in the quarter came in at 1.10% compared with the 1.50% witnessed in third-quarter 2018.
The company’s investment at fair value of Agency MBS was around $114.5 million as of Sep 30, 2019, up from $89.3 million as of Sep 30, 2018.
Moreover, Annaly’s book value per share came in at $9.21 as of Sep 30, 2019, declining from $9.33 as of the prior-quarter end. Additionally, book value per share compared unfavorably to $10.03 as of Sep 30, 2018. At the end of the third quarter, the company’s capital ratio was 11.2%, down from the 12.6% reported at the end of third-quarter 2018.
Leverage was 7:3:1 as of Sep 30, 2019, compared with 5:9:1 as of Sep 30, 2018. The company offered an annualized core return on an average equity of 8.85% in the July-September quarter, down from the prior-year quarter’s 10.85%.
Conclusion
During the third quarter, Annaly made significant securitization efforts within the residential credit business by completing a residential whole loan securitization for $463.4 million. Also, subsequent to the end of the quarter, it closed an additional securitization worth $465.5 million that boosted its aggregate issuance to $3.2 billion through seven transactions since the beginning of 2018. Amid robust activities in the U.S. housing market, these securitization efforts are encouraging.
Moreover, in June, the company authorized a $1.5-billion share-repurchase program, providing it additional flexibility within the company’s capital allocation framework. Since the beginning of third-quarter 2019, it has repurchased $223.2 million worth of common stock, including $68.2 million of shares repurchased subsequent to the third-quarter end. This indicates the company’s commitment to increase shareholder value through share buybacks.
Annaly Capital Management Inc Price, Consensus and EPS Surprise
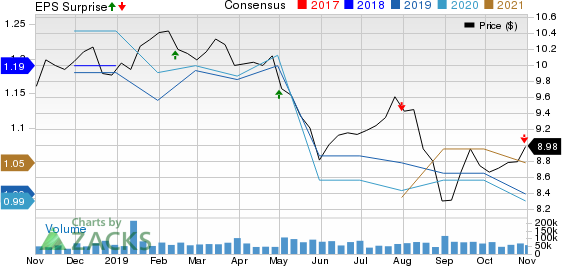
Annaly Capital Management Inc price-consensus-eps-surprise-chart | Annaly Capital Management Inc Quote
Currently, Annaly carries a Zacks Rank #3 (Hold). You can see the complete list of today’s Zacks #1 Rank (Strong Buy) stocks here.
Performance of Other REITs
Mack-Cali Realty Corp’s (NYSE:CLI) third-quarter 2019 core FFO per share of 38 cents missed the Zacks Consensus Estimate by a whisker. The figure also compared unfavorably with the year-ago quarter’s reported tally of 43 cents.
Boston Properties Inc.’s (NYSE:BXP) third-quarter FFO per share of $1.64 surpassed the Zacks Consensus Estimate of $1.62. Nonetheless, the reported tally remained flat year over year.
Ventas, Inc. (NYSE:VTR) delivered third-quarter 2019 normalized FFO per share of 96 cents, beating the Zacks Consensus Estimate of 94 cents. However, the figure came in lower than the year-ago tally of 99 cents.
Note: Anything related to earnings presented in this write-up represent funds from operations (FFO) — a widely used metric to gauge the performance of REITs.
More Stock News: This Is Bigger than the iPhone!
It could become the mother of all technological revolutions. Apple (NASDAQ:AAPL) sold a mere 1 billion iPhones in 10 years but a new breakthrough is expected to generate more than 27 billion devices in just 3 years, creating a $1.7 trillion market.
Zacks has just released a Special Report that spotlights this fast-emerging phenomenon and 6 tickers for taking advantage of it. If you don't buy now, you may kick yourself in 2020.
Click here for the 6 trades >>
Annaly Capital Management Inc (NLY): Free Stock Analysis Report
Boston Properties, Inc. (BXP): Free Stock Analysis Report
Mack-Cali Realty Corporation (CLI): Free Stock Analysis Report
Ventas, Inc. (VTR): Free Stock Analysis Report
Original post