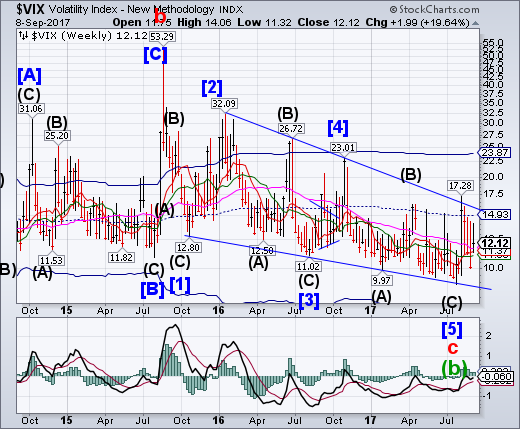
VIX had an inside week, but closed above Long-term support at 11.37. It is on a weekly buy signal with further confirmation above weekly mid-Cycle resistance at 14.93 and the Ending Diagonal trendline near 15.00. Could the initial foray in August have broken the trendline already?
The New York Times' DealBook had a great piece of journalism a couple of days ago about short VIX carry monkeys. Well, that is what I call them.
The article features a former Target logistics manager who has goosed his net worth up to $12 million by betting that the VIX will go down. He is in the process of raising $100 million for a VIX-smashing hedge fund.
SPX consolidates above Short-term support.
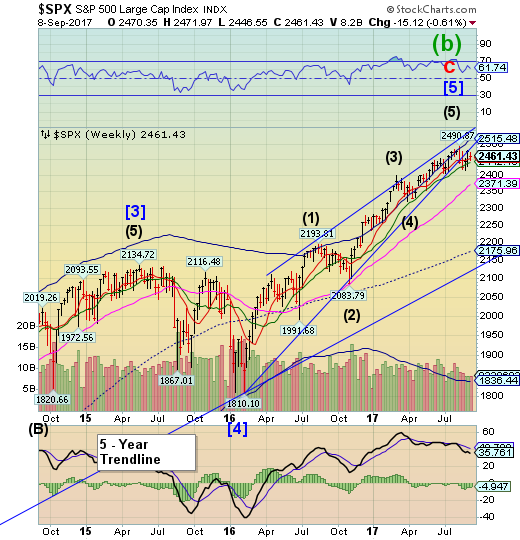
SPX consolidated above Short-term support at 2455.38. A reversal beneath Short-term support may re-introduce the sell signal. Should SPX not break above its prior high the current formation suggests a probable decline to or below 2300.00. Note that the retracement rally was repelled by the lower trendline of the Ending Diagonal beginning in February 2016.
The S&P 500 ended slightly lower on Friday as investors braced for potential damage from Hurricane Irma as it drove toward Florida, while a decline in big tech names like Apple (NASDAQ:AAPL) and Facebook (NASDAQ:FB) pushed the NASDAQ down more sharply.
The Dow eked out a gain, helped by a 4.0-percent rise in shares of insurer Travelers (The Travelers Companies Inc (NYSE:TRV)).
Insurer shares rose broadly, with the Dow Jones U.S. Insurance Index. Dow Jones Insurance up 2.1 percent, recouping some losses after being under pressure recently as the southern United States braced for another powerful storm closely on the heels of Hurricane Harvey.
NDX slips beneath its Cycle Top support.
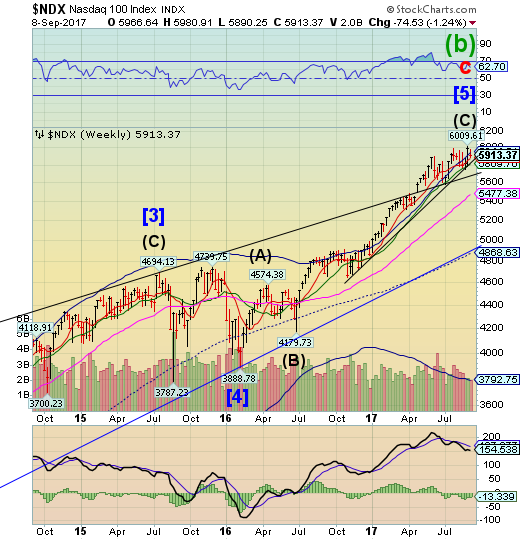
NDX slipped beneath its Cycle Top support/resistance at 5944.51. That is an initial sign of weakening and possibly a reversal. A decline beneath Intermediate-term support at 5809.76 and its Trump election trendline may produce a sell signal.
Technology shares have overtaken financial stocks as the top sector performer for the trailing one-year period based on a set of ETFs. The formerly high-flying financials have been clobbered recently, in part due to worries that falling bond yields and the blowback due to hurricanes striking the US will take a bite out of earnings for banks and insurers. Tech shares by contrast have been relatively steady this week, holding on to nearly all of the sector's 2017 rally.
The Technology Select Sector SPDR ETF (NYSE:XLK) (NYSEARCA:XLK) is the top sector performer, posting a strong 24.7% total return for the past 12 months through yesterday (Sept. 7). That's a comfortable lead over the number-two performance for the major US-sector landscape via the Financial Select Sector SPDR ETF (NYSE:XLF) (NYSEARCA:XLF), which is ahead by 22.0% on a trailing one-year basis.
High Yield Bond Index consolidates beneath its all-time high.
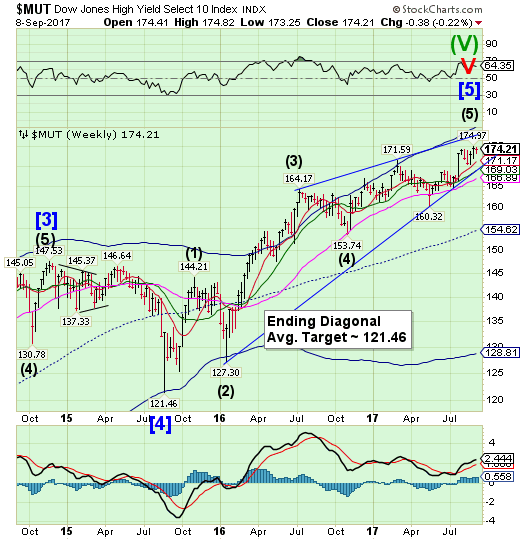
The High Yield Bond Index consolidated this week, closing beneath its all-time high. The Cycles Model suggestsits period of strength may be over.A sell signal may be generated should MUT fall beneath Intermediate-term support and its Ending diagonal trendline at 169.03.
You may wish to read the recent article in Financial Times.
Bond investors are playing a tricky game with lower-rated U.S. retailers, and they appear to be losing. Here's how it goes: Investors buy beaten-up bonds of struggling store operators and earn big regular payments for as long as they can. The bond buyers win if the companies remain solvent for longer than expected or even improve their outlooks. They can also win if the debt is relatively high in the capital structure and they're able to recover more money than they put in if the company goes bankrupt.
USB breaks out.
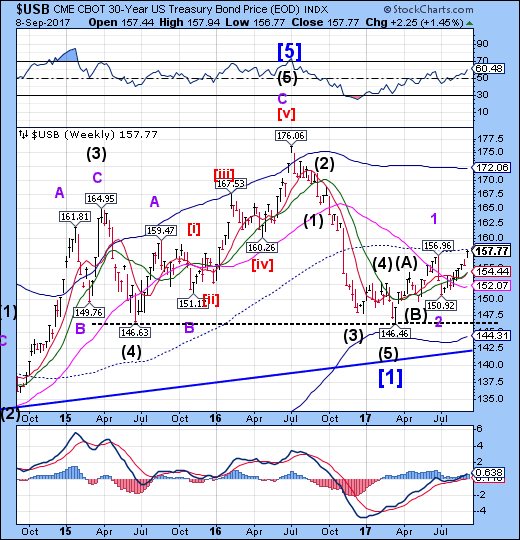
The Long Bond broke out to a new retracement high.Treasuries appear to be in a period of strength that may last another two weeks. Should the right shoulder of a potential Head & Shoulders reach proportionality, the rally may go to 165.00 or as far as the Cycle Top at 172.06.
A mere month ago, the benchmark 10-Year Treasury note seemed to be on a clear path to a 3% yield. Global economic growth was improving, oil prices were stabilizing, and Federal Reserve officials were not only talking about more interest-rate hikes, but also clearly planning to start shrinking their massive balance sheet, as well.
Most of that hasn’t changed, yet bond yields, which move inversely to prices, have done almost nothing but fall since then. At the close on Friday, the 10-year yield stood at 2.06% after dipping to 2.02%, the low of the year, early that morning.
Investors have benefited: So far this year, the iShares 20+ Year Treasury Bond (NASDAQ:TLT)TLT -0.21658415841584158%iShares 20+ Year Treasury Bond ETF U.S.: Nasdaq 129 -0.28 -0.21658415841584158% /Date(1504904400143-0500)/ Volume (Delayed 15m) : 9455180 AFTER HOURS 129.09 0.09 0.06976744186046512% Volume (Delayed 15m) : 353351 P/E Ratio N/A Market Cap N/A Dividend Yield 2.4431627906976745% Rev. per Employee N/A More quote details and news »TLT in Your Value Your Change Short position exchange-traded fund (ticker: TLT), for example, has delivered a total return of 10%.
The euro makes a new retracement high.
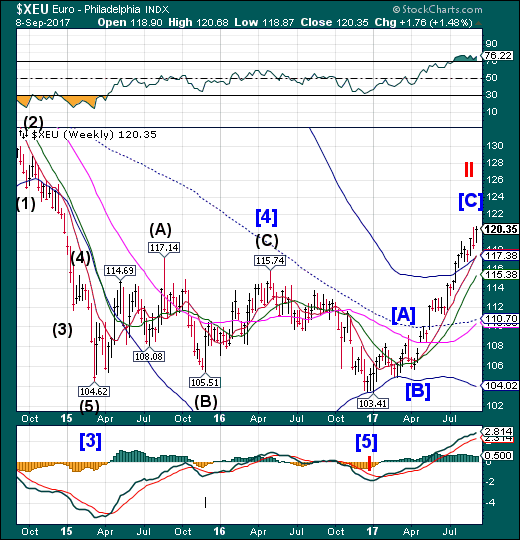
The euro made a new retracement high on waning strength. The Cycles Model suggests weakness may set in next week. A decline beneath the Cycle Top at 117.38 may be a sell signal. Traders are looking for a higher euro, but it may have reached a technical limit to this rally.
The European Central Bank has spent much of this decade convincing markets that the euro is irreversible. It is therefore mildly ironic that policy makers in Frankfurt may be in trouble because of the sudden return of confidence in the single currency.
Investors flocking to the euro have pushed it above $1.20, a 14 percent appreciation since the start of the year. The risk is that, by making imports cheaper, a stronger single currency will make it harder for the ECB to hit its inflation target, undermining the central bank’s plans for a smooth exit from its program of quantitative easing.
Euro Stoxx challenges short-term resistance.
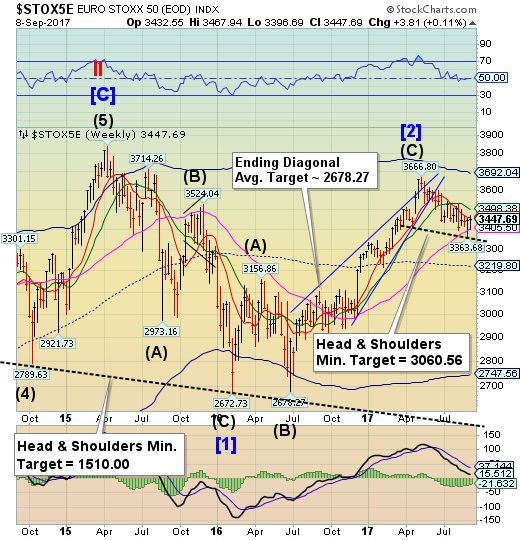
The Euro Stoxx 50 Index may have pushed the Head &Shoulders necklinelower as it bounced to challenge Short-term resistance at 3459.91. The Cycles Model suggests that this period of strength may be about to end. A reversal has the potential to set a cascading decline unto motion over the next several weeks.
(CNBC) European markets closed under pressure on Friday, as investors tracked the weak performance seen in markets overseas, while keeping an eye on the massive storm nearing the U.S.
The pan-European Stoxx 600 eked out gains by the close, finishing up 0.15 percent provisionally. On the week however, the index ended 0.17 percent down. Sectors pointed in different directions by the close.
Looking to bourses, the U.K.'s FTSE 100 underperformed fellow indexes, closing down 0.26 percent, while the French CAC and German DAX finished relatively flat, off 0.02 percent and up 0.06 percent respectively.
The yen breaks out against its April high.
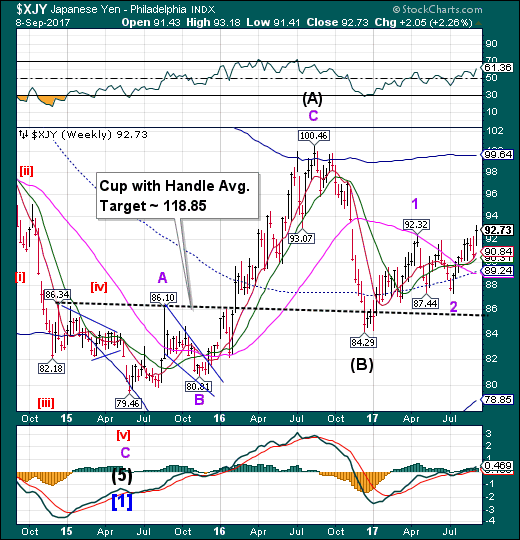
The yen broke out against its April high, technically signaling a probable continuation of the rally.It remains on a full-blown buy signal.
What happens to the yen if war breaks out with North Korea, pulling Japan into the conflict?
It’s a question that market players are starting to mull over, as tensions escalate over the dictatorship’s efforts to build an arsenal that can deliver a nuclear bomb to the U.S. Japan’s top ally. And there’s no fundamental agreement on what happens in the worst-case scenario.
"Beyond the immediate aftermath, the trajectory for the yen is much harder to call," said Yuki Masujima, an economist at Bloomberg Intelligence in Tokyo. Tomo Kinoshita, chief market economist at Nomura Securities Co., explained that “this is quite a difficult issue to analyze, because there are a lot of uncertainties," ranging from what Japanese investors would do and what the situation would be in the U.S. and prospects for its own economy.
Nikkei falls beneath Long-term support.
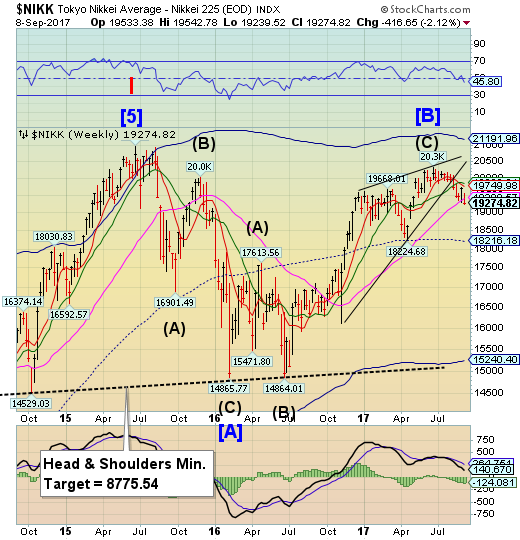
The Nikkei declined beneath Long-term support/resistance at 19398.57, reinforcing its sell signal. The chances of another bounce above Long-term resistance are minimal. A much deeper low awaits at the end of September.
Japan's Nikkei share average dropped to four-month lows on Friday while the broader Topix was almost flat as investors held off buying on concerns North Korea could launch another missile on Saturday to mark its founding day. The Nikkei fell 0.6 per cent to 19,274.82, its lowest close since April 28. The broader Topix was down 0.3 per cent at 1,593.54. On the week, the Nikkei lost 2.1 per cent while the Topix shed 1.6 per cent.
US dollar break down beneath its Cycle Bottom
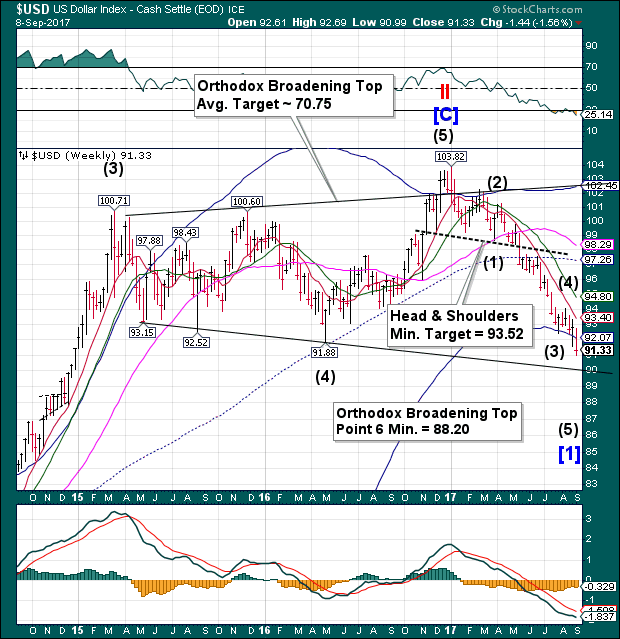
USD broke down beneath its Weekly Cycle Bottom support at 92.07, with the probability of continuing to its Orthodox Broadening Top short-term target. The lower trendline of the Orthodox Broadening Top at 90.00 may be the next attractor, but the formation calls for a breakout beneath the trendline, as indicated by “point 6.”
Speculators’ net short bets on the U.S. dollar grew to their highest since January 2013 in the latest week, according to calculations by Reuters and Commodity Futures Trading Commission data released on Friday.
The value of the dollar’s net short position, derived from net positions of International Monetary Market speculators in the yen, euro, British pound, Swiss franc and Canadian and Australian dollars, was $10.89 billion in the week to Aug. 29.
The previous week’s net short position was $10.28 billion (7.79 billion pounds).
Gold may have reached a seasonal high.
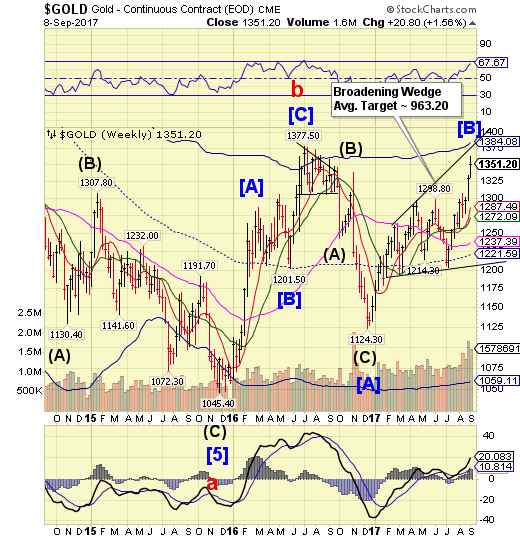
Gold may have inverted (high instead of low)its Cycle due to a strong seasonal influence. The last 60 days from its July 10 low has been one of the strongest seasonal periods for gold in years, resulting in the Trading Cycle inversion. The Cycles Model suggests a probable decline over the next two weeks.
Gold held near itshighest in more than a year on Friday as the U.S. dollar dropped and weak economic data lowered expectations of a December interest rate rise in the United States.
The U.S. dollar hit a more than 2-1/2-year low against abasket of major rivals on reduced expectations for anotherFederal Reserve rate increase this year, while the euro hitmulti-year highs after European Central Bank President Mario Draghi suggested that the ECB might begin tapering its massivestimulus program this fall.
A weaker dollar fuels demand for gold by making it cheaperfor holders of other currencies, and lower bond yields reducethe opportunity cost of owning non-yielding bullion. Interest rate rises push up bond yields and boost the dollar.
Crude lands above Intermediate-term support.
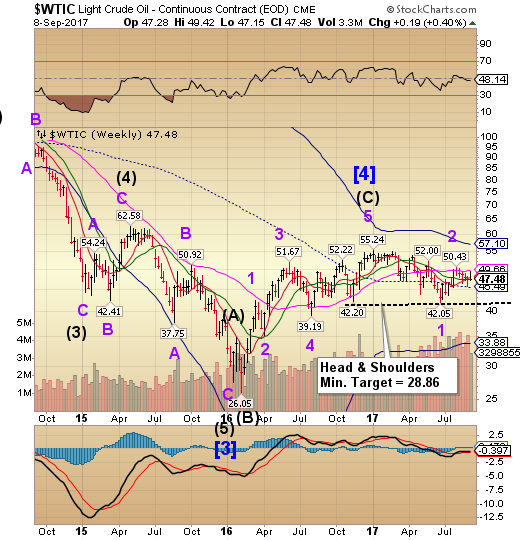
Crude attempted a challenge on Long-term resistance at 49.66 before closing above Intermediate-term support at 47.29. The sell signal is potentially in play with confirmation beneath mid-Cycle support at 45.49.
Oil prices collapsed again on Friday as China aims to reduce the capacity of its teapot refineries and Hurricane Irma zeros in on Florida. This dramatic drop in oil prices has ended several days of strong gains and created the largest spread between WTI and Brent in two years.
Harvey recovery continues. More refineries are trickling online. Crude is getting loaded on tankers in the ports of Corpus Christi for export. According to IHS Markit, Galveston Bay is operational, and the Houston shipping channel is mostly open. Three refineries in Lake Charles are finally receiving crude oil. Railroads are mostly back up and running. IHS Markit says that 8 of the 20 refineries impacted by Harvey are running at “normal” rates, while all but one of the other 12 are moving towards, or are in the process of, restarting.
Shanghai Index stalls at its high.
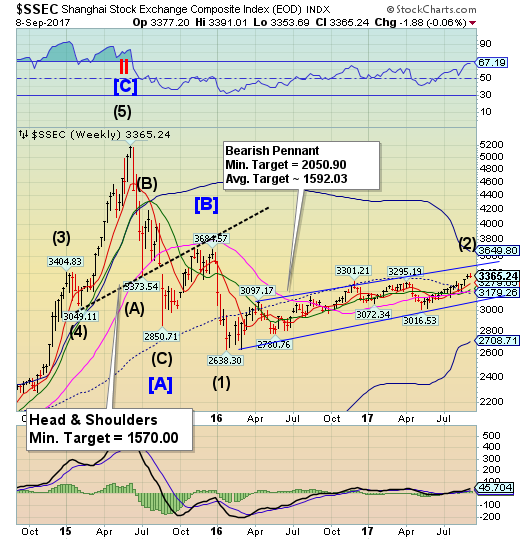
The Shanghai Index made a new high on Wednesday, but stalled as it winds up its period of strength. A decline beneath Intermediate-term support at 3216.05 puts it on a sell signal. The Shanghai Index now enters the negative season through the end of September. The potential for a sharp sell-off is rising.
And now, Trump finally has reason to be angry with China for intervening in its currency to manipulate it lower, not higher.
After the biggest weekly surge in the yuan on record, the first sign that Beijing had had enough of the relentless surge in the currency was unveiled overnight, when according to a Reuters report quoting "policy insiders" China had "begun to worry about a rallying yuan as exporters come under strain" a sign the currency’s gains might lose steam after it hit a two-year against the dollar just weeks before Beijing is set to host a crucial Communist Party gathering in the autumn.
For those who have not been following our daily morning update on the Yuan, here is how sharp the move has been in recent weeks, and how painful to countless yuan shorts who have been left with massive margin losses.
The Banking Index breaks Long-term support.
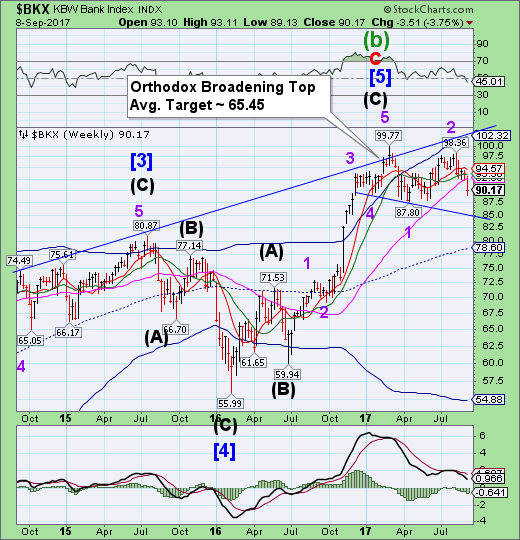
BKX broke Long-term support at 92.68 as its declines beneath its supportto find a new level. It remains on a confirmed sell signal. If the Orthodox Broadening Top formation is correctly identified, the next level of support may be the mid-cycle line at 78.60.
Among the most appalling aspects of the financial collapse nine years ago was that no matter how reckless and predatory big financial institutions had been, they had grown so big and so interconnected that the federal government found itself forced to prop them up to avoid failures that would wreck the economy. The resulting bailouts, which included billions of dollars in bonuses for executives responsible for the fiasco, provoked deep public anger and became a rallying cry for populists on the right and the left.
To reduce the risks from too-big-to-fail institutions, Congress in 2010 passed the Dodd-Frank financial oversight bill. But ever since, even as the stock market soared, wages stagnated and the victims of predatory lenders continued to struggle, Wall Street’s champions have demanded an end to Dodd-Frank’s regulations.
Step by step, the Trump administration has made it clear that it is on their side, that Wall Street need have no real concern about Dodd-Frank’s provisions and that the lessons of the financial crisis will be ignored.
Commodities revenue at major banks took a further knock in the first half, sinking to an 11-year low amid poor performances in energy.
Combined income at 12 top banks including Goldman Sachs Group Inc (NYSE:GS). and JPMorgan Chase & Co (NYSE:JPM). slid 41 percent to $1.3 billion in the first six months of the year, analytics firm Coalition Development Ltd. said in a report Thursday. Earnings were particularly hit in power and natural gas.
Banks’ commodities revenues, now the smallest in Coalition data going back to 2006, have been shrinking in recent years amid regulatory scrutiny, low volatility, curbs on proprietary trading and diminished investment by their hedge-fund clients. This year’s drop is also likely to reflect bad performance at Goldman Sachs, whose once mighty commodities unit is now struggling.
In a new downgrade of subprime lenders Capital One and Synchrony, Morgan Stanley (NYSE:MS) sought to answer the nagging question of why subprime credit card losses are suddenly soaring, per the chart below, "if employment is so good."
After reportedly spending the entire month of August analyzing that question, Morgan Stanley came to many of the same conclusions that we note a regular, recurring basis. Apparently, those soaring delinquencies have something to do with stagnant wages in the face of soaring healthcare costs, rising rents and a pullback in consumer credit extension, who could have guessed that?
Investors ask, "Why are card losses rising if employment is so good?" Our deep dive & quant work shows subprime is stretched from higher rent, healthcare costs & low wage growth, with lower credit availability a coming drag.
