- U.S. futures, European shares downbeat ahead of key data, Fed decision
- Chinese stocks take a hit from higher expectations of dwindling stimulus
- Bitcoin stuck between bottom and 2018 lows
- Oil drops on Trump's call for lower prices
- U.S. Trade Representative Robert Lighthizer and Treasury Secretary Steven Mnuchin travel to Beijing to continue trade talks, targeting a final deal by early May.
- The Bank of England sets interest rates and updates its economic forecasts on Thursday, with Governor Mark Carney holding a press conference.
- Data on Friday is expected to show non-farm payrolls rose by 185,000 and unemployment rate grew 3.8% in April. Average hourly earnings growth are forecast to have picked up to 3.3%.
- Alphabet (NASDAQ:GOOGL), scheduled to release earnings after market close today, is expected to show an EPS of $10.53 and a revenue of $37.3 billion. Analysts expect Google's parent company to keep hold of its leadership in the tech space.
- General Electric (NYSE:GE), due to report corporate results before market open on Tuesday, is likely to show a $0.09 EPS and a $26.98 billion.
- Pfizer (NYSE:PFE) is also due to report its earnings results tomorrow before market open. Analysts forecast a $0.75 EPS and $13 billion revenue.
- McDonald’s (NYSE:MCD), also releasing corporate results tomorrow before market open, with a $1.76 EPS and $4.94 billion.
- Apple (NASDAQ:AAPL), set to report earnings after market close on Tuesday, is predicted to post a $2.37 EPS over a $57.58 billion revenue. Financial results from the tech giant will be closely watched after the company cut its revenue outlook for the first time in almost two decades earlier this year.
- The MSCI All-Country World Index climbed less than 0.05%.
- The U.K.’s FTSE 100 fell 0.1%.
- The MSCI Emerging Market Index gained 0.4%, the biggest climb in almost two weeks.
- The Dollar Index dipped less than 0.05% to a two-day 0.24%
- The euro climbed 0.1% to $1.1161.
- The British pound ticked 0.2% higher to $1.294.
- The Japanese yen fell 0.1% to 111.69 per dollar.
- The yield on 10-year Treasurys gained one basis point to 2.51%, the largest gain in a week.
- Germany’s 10-year yield climbed two basis points to 0.00%.
- Britain’s 10-year yield rose two basis points to 1.161%.
- West Texas Intermediate crude slid 0.7% to $62.85 a barrel, the lowest in more than three weeks.
- Gold dropped 0.2% to $1,283.27 an ounce, the largest dip in almost two weeks.
- The Bloomberg Commodity Index fell 0.1%, reaching the lowest in seven weeks on its fifth straight decline.
Key Events
European stocks and futures on the S&P 500, Dow and NASDAQ 100 were mixed this morning as investors braced for big economic data appointments, including the Fed's monetary policy meeting on Wednesday and monthly job numbers on Friday.
The STOXX Europe 600 slipped into red territory after climbing to the highest level since July 2018—though it still remained beneath last week’s high-wave candle peak.
In the earlier Asian session, regional shares also ended mixed on thin trading, with Japanese markets kicking off a 10-day "Golden Week" break ahead of the abdication of Emperor Akihito in favour of Crown Prince Naruhito. Future contracts on the Nikkei still managed to advance 0.60%
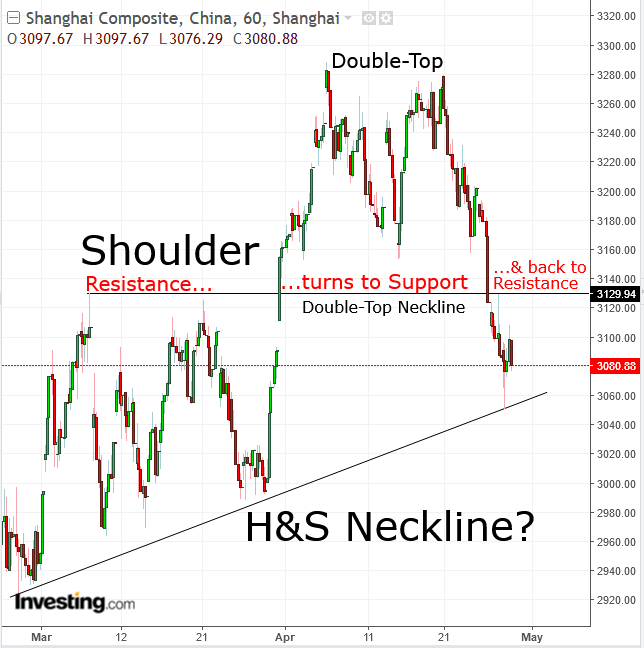
A rally on China’s Shanghai Composite turned into a 0.77% drop after the beneficial effects of strong U.S. GDP growth and Chinese industrial profits—which rebounded after four months of contraction in March— fizzled out.
The Chinese benchmark index fluctuated wildly between a 0.71% gain and a 1.15% loss as traders took advantage of thin volumes after the country’s equities suffered their worst week versus global stocks since 2016. Technically, it confirmed the resistance of a double-top neckline on the hourly chart, which may be the head of an upsloping H&S top, after the price attempted, but failed, a climb above the 50 DMA. Such a scenario is in stark contrast with better-than-expected economic data. Ironically, the rosier outlook is hurting stocks, on speculation that Chinese policymakers won’t follow through with further stimulus.
U.S. investors have been facing the same backward logic, prompting rallies on disappointing data on the promise of a more dovish Fed and selling off when data showed signs of growth. This short-sightedness has been center stage since the 2016's Brexit vote and the macro jitters that ensued.
Meanwhile, South Korea’s KOSPI outperformed its regional peers, surging 1.7%, Hong Kong’s Hang Seng advanced 0.97% and Australia’s S&P/ASX 200 dropped 0.41%.
Global Financial Affairs
U.S. stocks hit fresh records on Friday. The S&P 500 (+0.47%) posted both a record close and an all-time high, as the session ended at the very highest point of the trade. The NASDAQ Composite (+0.34%) registered a new record on a closing basis after setting a fresh all-time high on Thursday. Conversely, the Dow Jones Industrial Average (+0.31%) and Russell 2000 (+1.01%), while also sealing upbeat gains, hovered below record levels—with the latter very far from them.
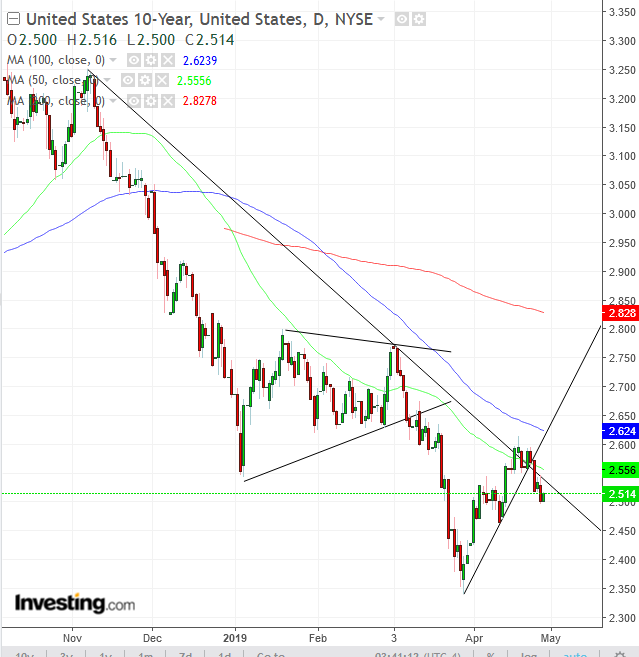
The yield on 10-year Treasurys edged higher at the European open, after remaining broadly flat during the Asian session. However, the climb is considered a correction within a clear downtrend.
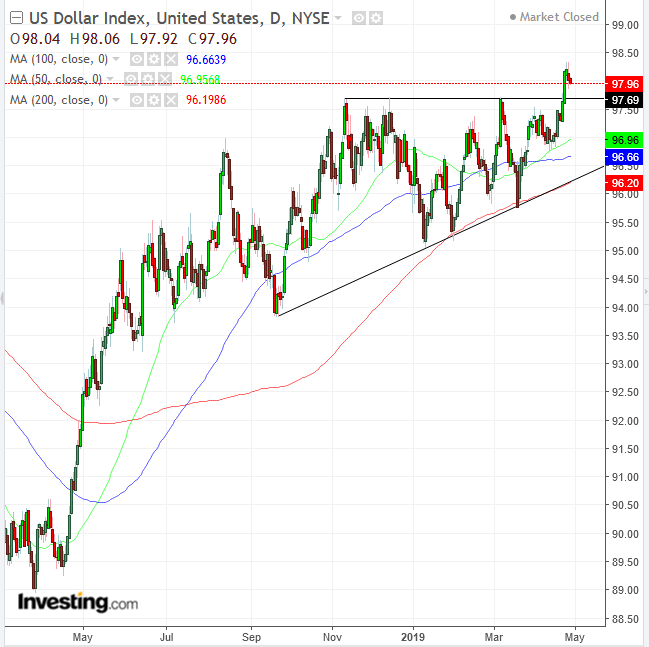
The dollar also crawled into the green after falling for a second day, on a return move toward an ascending triangle, which pushed it to an 11-month high last week. Disappointing U.S. inflation figures later today would support speculation that the Fed will cut interest rates this year. The market is already pricing in a 50% chance for a cut in September. High level U.S.-China trade talks are also being monitored.
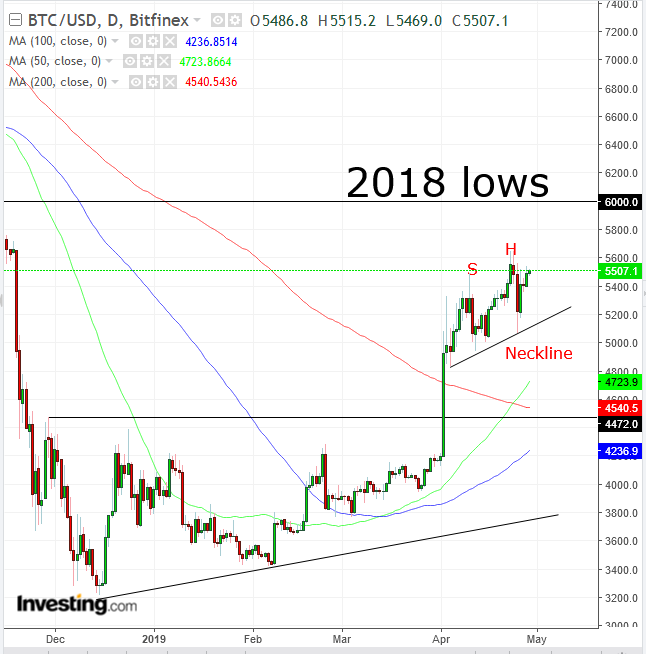
Meanwhile in crypto markets, the Bitcoin price has been unable to scale above the $6,000 levels it hit in its 2018 lows, despite a 20% surge on April 2, which extended to a 34% breakout of an ascending triangle-bottom from April 23. The BTC/USD trading behavior this month resembles the upsloping trend seen on the Shanghai Composite chart. The digital currency is fighting for its life between the ascending triangle, whose implied target has been mostly achieved, and the resistance of the 2018 lows.
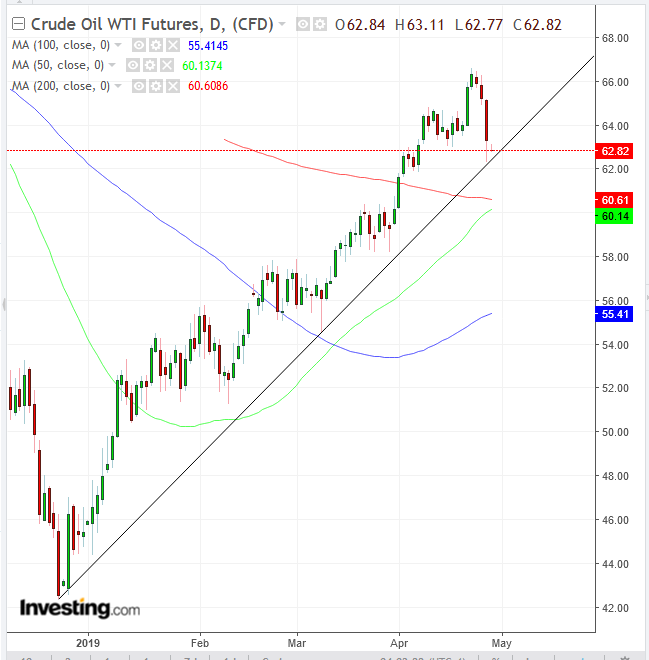
WTI opened lower, falling for the fourth day, as U.S. President Donald Trump returned to pressuring OPEC to keep prices low. Technically, the price remained above the uptrend line since the December bottom, as the 50 DMA rushes to cross a flattening 200 DMA, set for a golden cross.
Up Ahead
Earnings
Market Moves
Stocks
Currencies
Bonds
Commodities
