Market Brief
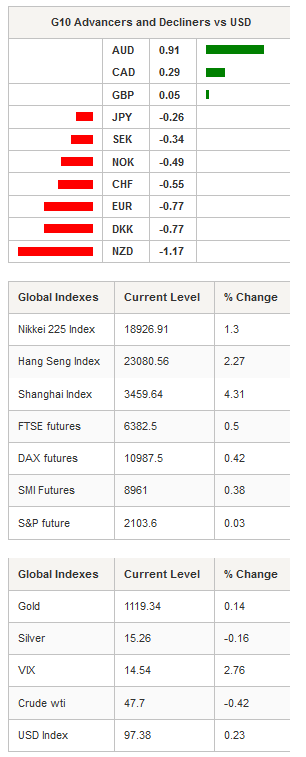
In the wake of the RBA decision to keep rates unchanged, the Australian dollar continues to gain ground, boosted by the hawkish tone of the accompanying statement. AUD/USD is consolidating above the 0.7197 resistance level (Fib. 38.2% on September-October rally). The 0.7082-0.71 area remains the stronger support (Fib. 61.8% and psychological threshold), while on the upside, the high from October 12th will act as resistance. We remain bullish on the Aussie, but we believe that AUD/NZD is the best cross to take advantage of the Aussie’s bull run. The New Zealand dollar is the biggest looser among the G10 complex over the last 5 days. The kiwi lost 0.70% against the USD, 1.97% against the Aussie, 0.83% against the EUR and 0.95% against the Swiss franc.
As expected, the job report released yesterday by Statistics New Zealand showed that the job market is in worse shape than was anticipated. The unemployment rate rose to 6% in the third quarter from 5.9% in the March quarter. However, in spite of this apparent stability, the details are not pretty. The number of employed people contracted -0.4%q/q over the summer months, while the participation rate fell to 68.6% from 69.3%. NZD/USD currently sits on the 0.6645 resistance level (Fib. 38.2% on September-October rally) and seems determined to break it to the downside.
On the equity front, Asian regional markets are trading in positive territory across the board. China’s mainland stocks were leading the pack with the Shanghai Composite up 4.31, while its tech-heavy counterpart, the Shenzhen Composite, rose 5.12%. In Japan, stock markets open substantially higher after being close for Culture Day yesterday. However, both the Nikkei and the Topix were unable to maintain those gains. The Nikkei was up 1.30%, while the Topix rose 0.88%. Elsewhere, Hong Kong’s Hang Seng gained 2.26%, South Korea’s Kospi rose 0.21%, while in Taiwan, the Taiex soared 1.65%.

As usual, USD/JPY is moving sideways and is lacking the strength to escape its 4-week range. Japan’s PMIs were released earlier this morning and painted a brighter picture. Service PMI rose to 52.2 from 51.4 a month earlier, while composite PMI climbed to 52.3 in October from 51.2. USD/JPY is currently trading around 121.
In China, Caixin services PMI scaled to a 3-month high to 52, from 50.5 previous reading. The composite PMI almost printed above the 50 mark, which delimit contraction from expansion as it came in at 49.9.
In Europe, equity futures are trading in positive ground. The Footsie is up 0.50%, the DAX 0.42%, the CAC 0.42% and the SMI 0.38%, while the broader Euro Stoxx 600 gained 0.58%.
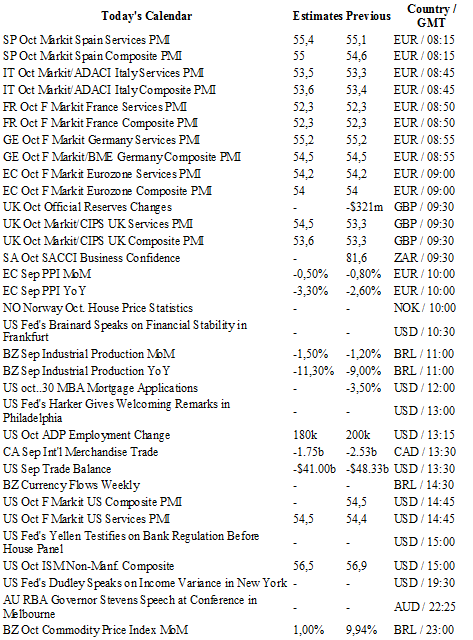
Today traders will be watching Markit PMIs from Spain, Italy, France, Germany, UK and the Eurozone; PPI from the Eurozone; industrial production from Brazil; Mortgage application, ADP employment change, trade balance, Markit PMIs and ISM non-manf. Composite from the US.

Currency Tech
EUR/USD
R 2: 1.1495
R 1: 1.1387
CURRENT: 1.0930
S 1: 1.0809
S 2: 1.0458
GBP/USD
R 2: 1.5819
R 1: 1.5659
CURRENT: 1.5428
S 1: 1.5202
S 2: 1.5089
USD/JPY
R 2: 125.86
R 1: 121.75
CURRENT: 121.11
S 1: 118.07
S 2: 116.18
USD/CHF
R 2: 1.0240
R 1: 1.0129
CURRENT: 0.9928
S 1: 0.9476
S 2: 0.9384
