Tuesday August 1: Five things the markets are talking about
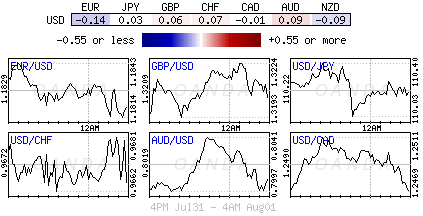
Global equities continue to remain better bid on corporate earnings and promising Asian economic data, while the mighty dollar takes a time-out overnight, trading sideways as the market digests the latest developments in Washington.
In July, the dollar slid for a fifth-consecutive month, its longest losing streak in six-years, as the market grew more cautious on prospects for growth-supportive U.S policies and the path for higher interest rates.
President Trump’s agenda has repeatedly hit political roadblocks while U.S. inflation has also softened, a potential obstacle for Ms. Yellen and the rest of the Fed.
Note: Fed funds futures see a less than 50% chance that the Fed sticks to its plans to hike rates again this year.
Now, it’s back to the drawing board, today’s U.S manufacturing data (10:00 am EDT) and Friday’s non-farm payrolls release will provide further clues on the health of the U.S economy.
1. Stocks grind higher
In Japan, brisk corporate earnings continue to boost the Nikkei (+0.3%), but a stronger yen (¥110.37) continues to caps the gains. The broader Topix added +0.6%.
Down-under, Australia’s S&P/ASX 200 Index closed +0.9%, while South Korea’s KOSPI index ended up +0.8%.
In Hong Kong, the Hang Seng Index rallied +0.7%, closing at a 25-month high after completing a seventh-straight month of gains while the Shanghai Composite Index climbed +0.3%.
In China, blue chips reached a 19-month high on an upbeat factory survey (China Caixin PMI 51.1 vs. 50.4) – both output and new orders rose at the fastest pace since February on strong export sales. China’s CSI 300 index rallied +0.9%, while the Shanghai Composite Index added +0.6%.
In Europe, regional bourses trade modestly higher across the broad, supported by stronger PMI data out of China as well as a weakening U.S dollar. Corporate earnings continue to come in generally positive with the FTSE outperforming following results from the resource and automotive sectors.
U.S stocks are set to open in the black (+0.4%).
Indices: Stoxx600 +0.5% at 379.8, FTSE +0.8% at 7428, DAX +0.5% at 12173, CAC 40 +0.5% at 5120, IBEX 35 +0.8% at 10585, FTSE MIB +0.3% at 21560, SMI +0.4% at 9055, S&P 500 Futures +0.4%
2. Oil hits two-month high, further U.S inventory drop seen, and gold steady
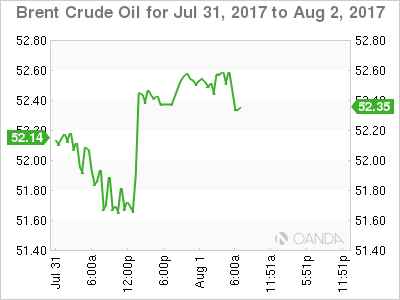
Oil prices continue to climb, trading atop of its two-month highs supported by signs that a persistent supply glut is starting to ease amid strong demand and OPEC-led production curbs.
Note: U.S inventory data today and tomorrow are expected to show crude stocks falling by -2.9m barrels last week, the fifth straight week of declines.
Brent crude is up +12c at +$52.84 a barrel, while U.S light crude (WTI) is up +20c at +$50.37.
Oil company BP (LON:BP) remains upbeat on the demand outlook, stating this morning that global demand recovered in Q2 and was expected to grow by +1.4 to +1.5m bpd – that’s higher than OPEC’s own forecasts.
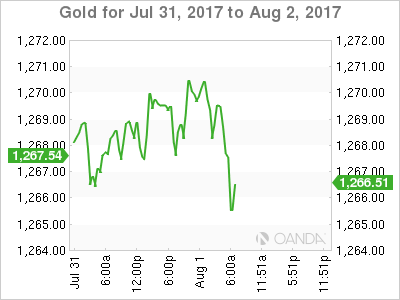
Gold prices are trading atop/near its seven-week high overnight (+0.2% to +$1,269.27 an ounce) as tensions on the Korean peninsula boosted safe-haven demand for the precious metal – It gained +1.1% last week in what was its third consecutive weekly gain.
Silver also rallied +1.2% last week, its third straight weekly gain, while copper climbed +1.2% to +$2.91 a pound, its highest price in more than two-years.
3. Yield curves trade in a tight range
Yesterday’s U.S Treasury bill auction demand for six-month product was low, near the bottom of the yearly range, while the three-month bills saw its highest demand since July 3.
Auction results:
+$39B 3-month bills drew +1.070%, with a bid-to-cover of 3.18, while +$33B 6-month bills drew +1.130%, and a bid-to-cover 3.08 – 3-month +84.5% allotted at the high, while 6-month only +12.0% were allotted at the high.
Overnight, the Reserve Bank of Australia (RBA) left its cash target rate unchanged (+1.5%) as expected, and noted that the recent AUD (A$0.8000) strength is more about the ‘big’ dollar weakness.
The yield on U.S. 10-Year Treasuries gained +1 bps to +2.30%, while Germany’s 10-year Bund yield decreased less than -1 bps to +0.54%. The UK 10-Year Gilt yield gained +1 bps to +1.237%, the highest in a week. The Bank of England (BoE) rate announcement is this Thursday and no change is expected.
4. Dollar: Investors are betting against Trumponomics
U.S political uncertainty continues to drive the ‘mighty’ buck lower across the board. Another hasty shakeout in the Trump administration yesterday is adding further uncertainty over the greenback as the market begins to price out another Fed rate hike in coming months.
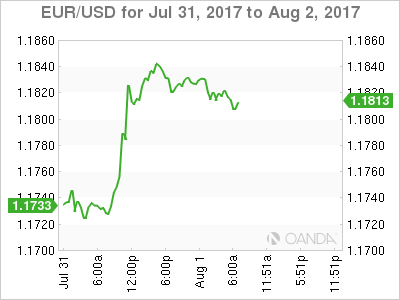
The EUR/USD (€1.1817) remains above some key technical and psychological levels after President Trump ousted recently hired White House communications Chief Scaramucci yesterday afternoon. The market remains very skeptical that Trump will be able to get plans for tax reforms and infrastructure spending through Congress.
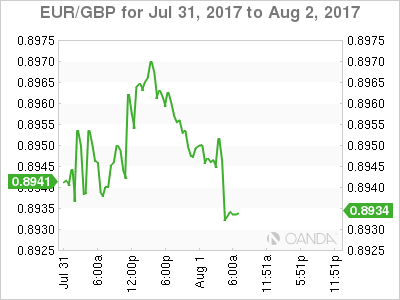
Elsewhere, USD/JPY (¥110.33) trades atop of its six -week lows, but maintains a foothold above the psychological ¥110 level. Sterling is little changed, up +0.2% at £1.3223.
5. U.K manufacturing activity accelerates, Eurozone grows
Data this morning showed that U.K manufacturing activity growth accelerated in July, as strong exports boosted orders.
The purchasing managers’ index (PMI) for British manufacturing rose to 55.1 m/m, from June’s downward-revised reading of 54.2. It beat market expectations of 54.9.
Digging deeper, it was noted that despite the exchange rate remaining a key driver of export growth, manufacturers also benefited from stronger economic growth in key markets in the Eurozone, North America and Asia-Pacific regions.
Other data showed that the Eurozone economy grew by +0.6% in Q2 and +2.1% year-on-year, in line with expectations. That converts into a +2.3% annualized growth rate – a tad slower than the U.S, but faster than the U.K.
Note: The year-on-year figure is the highest in six-years and reason why the ECB is talking tapering monetary easing.
