by Pinchas Cohen
Key Events
- Crude tumbles into bear market territory on oversupply worries
- US stocks retreat from all-time highs on oil data
- Safe haven assets bounce, as investors' inflation fears return
Global Affairs
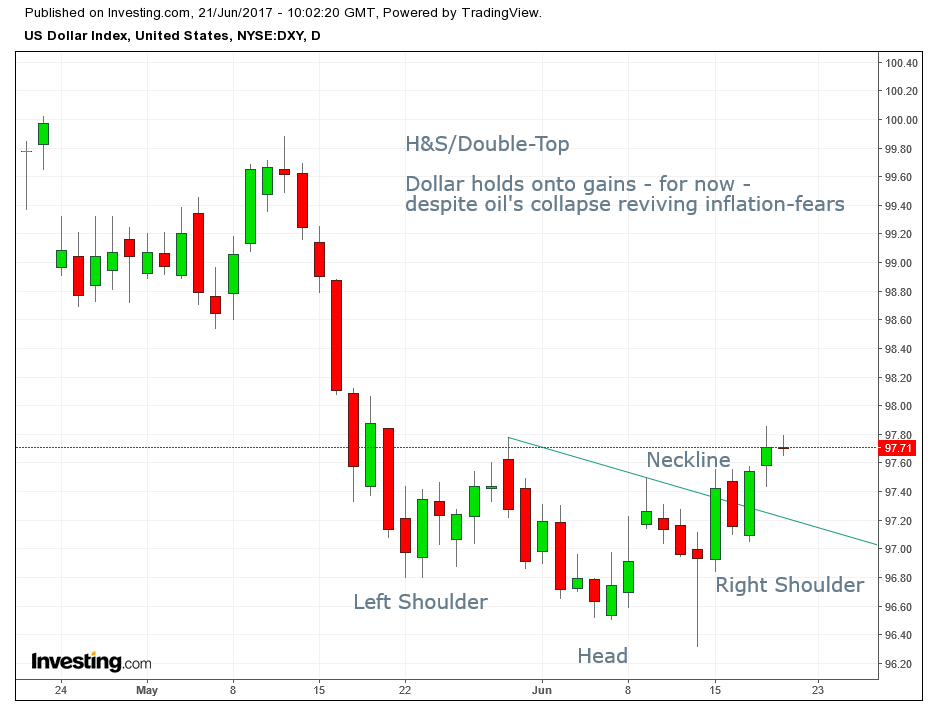
After US shares registered new all-time highs, the energy sector pulled them down due to the increasing global oversupply of oil. The dollar managed to maintain its gains, boosted by Fed officials’ optimistic outlook on US economic growth. Safe havens—Treasury yields, the yen and gold—all strengthened.
Both the S&P 500 and the Dow Jones Industrial Average registered record closes on Monday, with the Dow finishing the day at its highest point, 21,528.99, in a demonstration of unwavering trader confidence by remaining exposed overnight. This newfound optimism comes after a series of geopolitical concerns seem to have faded—except for contentious Brexit negotiations—compounded by the Fed's optimism for the US economy.
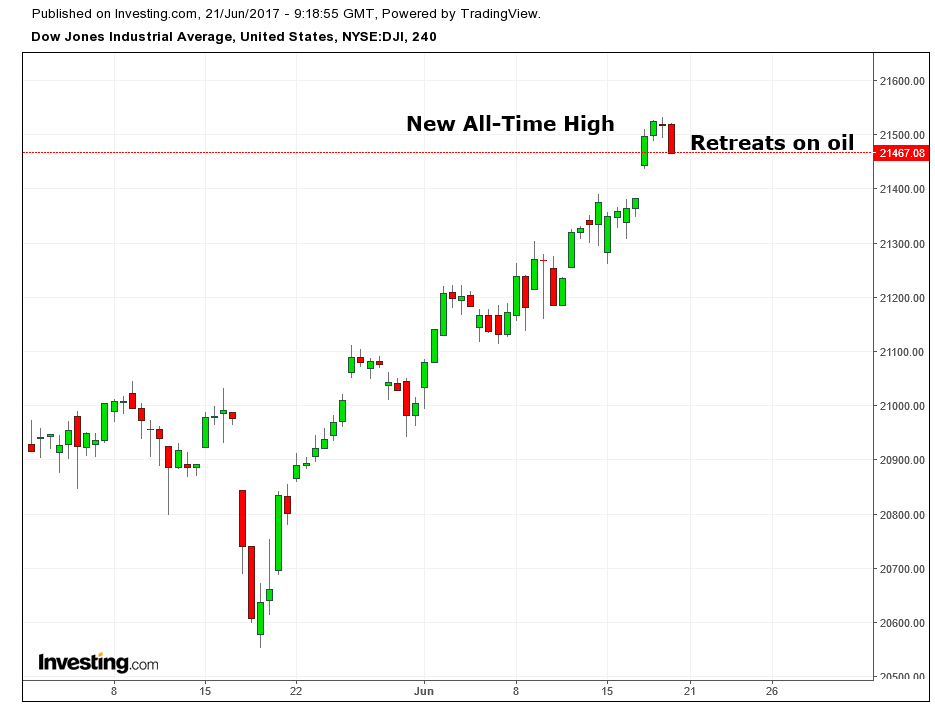
The Dow also achieved a fresh all-time high on Tuesday at 21,534.04 on an intraday basis, before being dragged down by oil and potential investor pessimism regarding reflation.
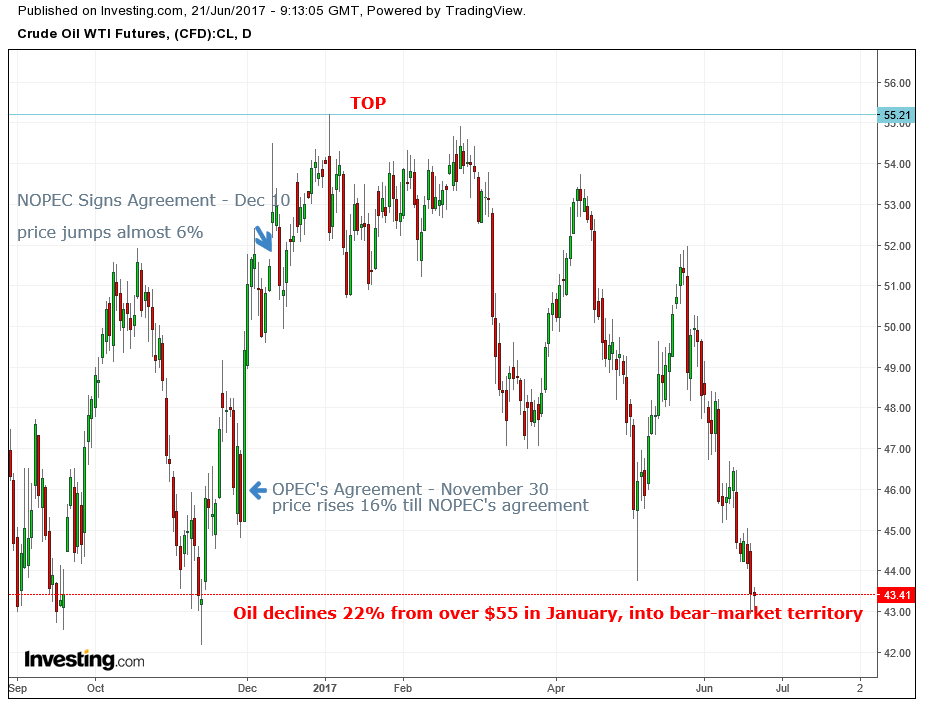
Traders reacted quickly when they realized that OPEC/NOPEC hadn't succeeded in limiting global oil supplies, as crude fell below its November 30 price, the day OPEC signed its original production freeze agreement. This led to the wipe-out of crude's 22-percent of gain since the arrangement was set. OPEC’s cuts are being overwhelmed by Libya’s pumping at its highest production levels in four years, along with an unexpected output spike by Nigeria, two OPEC members exempt from cutting supplies.
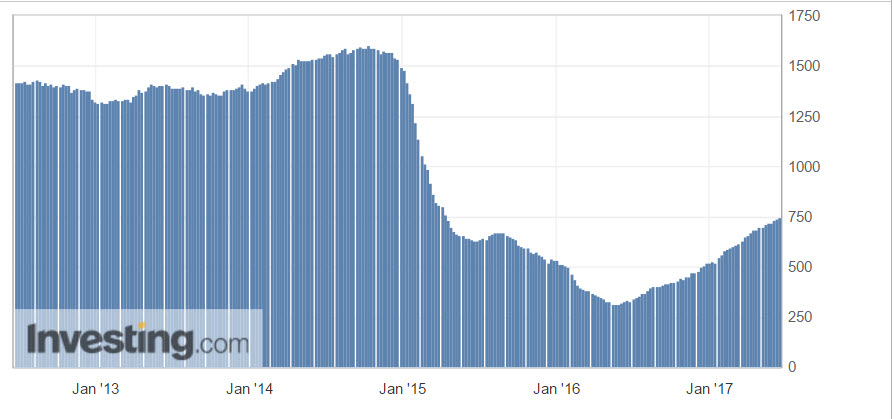
Furthermore, OPEC’s limit on shipments to Asia has been undermined by China, Canada and Brazil, while US shale producers increased their number of operational oil rigs for 22 straight weeks.
Fundamentally, it’s hard to see the light at the end of the oil tunnel, as any possible rise will be met with heavy resistance. Global supply levels include the largest amount of crude stored on oil-tankers for 2017, which are waiting to be sold at higher prices, as well as almost 6,000 incomplete rigs across US oil fields—the highest in 3 years—waiting for production. A rising greenback, which bottomed out in the medium-term, will add more pressure on the dollar-priced commodity.
Technically, the price of oil failed a massive reversal pattern, suggesting a falling trajectory.
After last Wednesday's optimistic FOMC meeting,investor confidence was boosted on the hopes of rising inflation. Now though, with the oil crisis worsening it seems that fears of a deflation are returning—driving down stocks, while lowering Treasury yields, the yen and gold. But with the latest oil drama, the yen strengthened, paring back some of the Japanese currency's losses on Monday, while gold rose after a five-day sell-off.
In a surprise shake-up, Saudi Arabia's Deputy Crown Prince Mohammed Bin Salman was named heir to the Saudi throne by his father King Salman, ousting his cousin. This shift consolidates the 31-year old’s power as the leader of the world’s biggest oil exporter. The new heir was the driving force of the original production cut agreement, but it has been his ambitious plan to wean Saudi Arabia off its total economic dependence on oil.
The timing of this dramatic announcement comes ahead of the kingdom's floating its national oil company, Saudi Aramco, next year on domestic and international stock exchanges, as part of the Deputy Crown Prince's ambitious economic reform. The IPO offering could break records with a potential value of $ 1 trillion (based on analyst estimates) to $2 trillion (based on Saudi Arabia's optimistic valuation), making it the world's largest listed company, by far, after Chinese bank ICBC (SS:601398) with its "mere" $229.9 billion market cap.
Today global markets resumed their retreat from near-record highs, as Asia and Australia both tried to play catch-up after US markets retreated, compounded by crude extending yesterday's decline.
China's Shanghai Composite fluctuated, while Hong Kong shares fell, after the MSCI decided to include domestic Chinese shares on a limited basis. The American index provider will add 222 China A-share stocks beginning May 2018. China’s $6.8 trillion domestic market is the world’s second largest, comprising 9 percent of global stock value. Although the inclusion will be on a small scale, being part of MSCI’s $1.6 trillion global share index is still a very bullish indicator for Chinese equities.
European markets continued to decline, led by financials and oil.
Upcoming Events
- Still to come on the Fed speaker list: Eric Rosengren, Robert Kaplan, Jerome Powell, James Bullard and Loretta Mester.
- BOJ Governor Haruhiko Kuroda will speak in Tokyo.
- ECB board member Benoit Coeure will speak in Frankfurt on Wednesday.
- New Zealand’s central bank is expected to leave its benchmark interest rate at a record low when it meets on Thursday.
Market Moves
Stocks
- The Shanghai Composite rose 0.3 percent as of 3:48 p.m. after falling as much as 0.2 percent and rising as much as 0.5 percent.
- Hong Kong’s Hang Seng and the Hang Seng China Enterprise Index each fell 0.5 percent.
- Australia’s S&P/ASX 200 Index slumped 1.6 percent to its lowest level since Feb. 9, erasing its gains for the year. Both BHP Billiton (AX:BHP) and Rio Tinto (AX:RIO) slid at least 2.9 percent.
- Japan’s TOPIX fell 0.4 percent, after climbing for three days to its highest level since August 2015.
- South Korea’s KOSPI dropped 0.5 percent.
- The MSCI Emerging Markets Index slid 0.4 percent. ADRs for YPF (NYSE:YPF), Argentina’s state-run oil producer, slumped 10 percent in after U.S. trading closed amid disappointment over MSCI’s decision. Grupo Financiero Galicia SA ADR (NASDAQ:GGAL) lost 5.8 percent.
- Contracts on the S&P 500 dropped 0.1 percent. The gauge’s retreat on Tuesday was led by energy stocks and consumer discretionary producers, which slumped 1.3 percent.
- The Stoxx Europe 600 erased its gains to end 0.75 percent lower on a falling gap.
- The DAX fell 0.63% at 12,735.75
Commodities
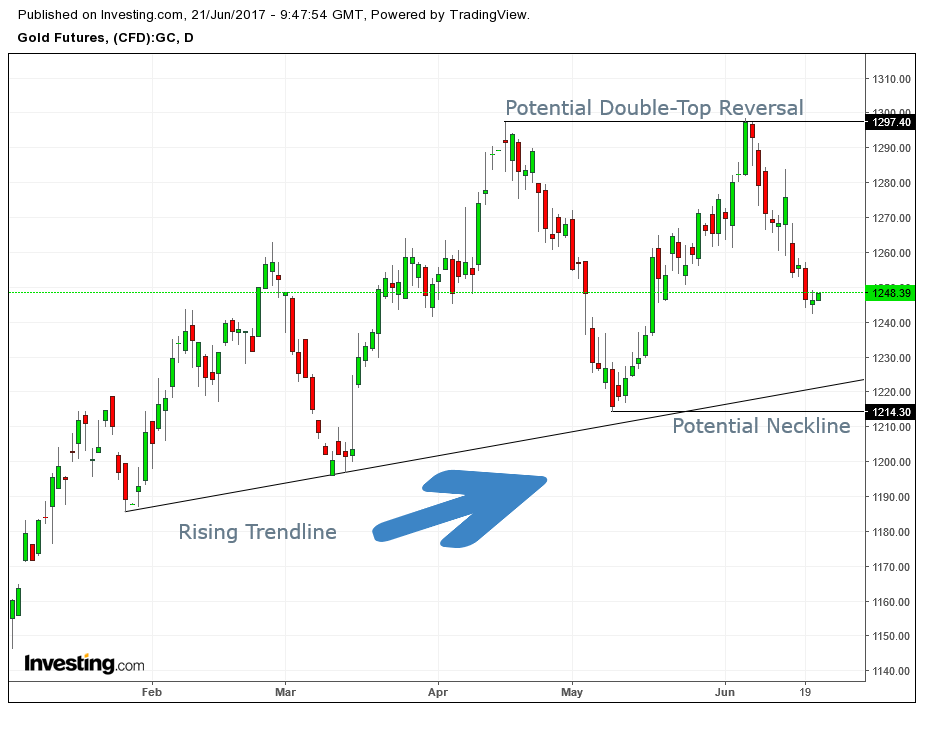
- Gold rebounded 0.2 percent to $1,245.51 an ounce, after falling for five consecutive days.
- West Texas crude rose less than 0.1 percent to $43.54. Futures tumbled more than 2 percent on Tuesday, reaching their lowest since August.
Currencies
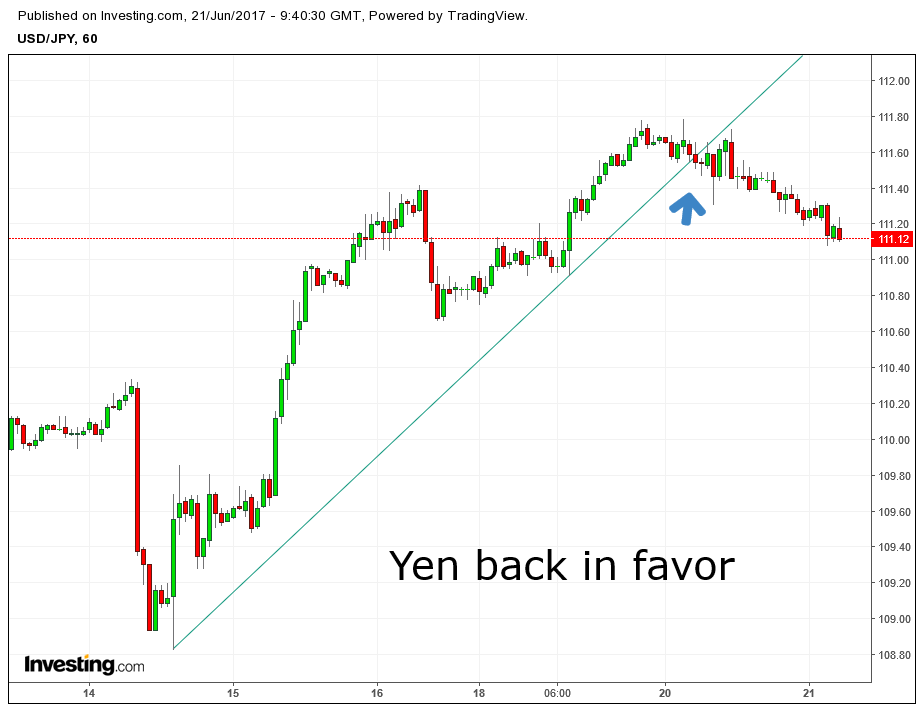
- The yen rose 0.1 percent to 111.30 per dollar, after gaining 0.1 percent on Tuesday. It had retreated 0.6 percent the previous session.
- The Australian dollar lost 0.2 percent, dropping for a third day.
- The Korean won dropped 0.8 percent to its weakest level since April.
- The Dollar Index extended yesterday’s 0.17 percent gain with an additional 0.7 percent to 97.76. The DXY completed a bottom below 96.50, and—like oil—is still at its lowest level since November.
- The British pound slipped less than 0.1 percent to $1.2621, after Tuesday’s 0.9 percent drop. Bank of England Governor Mark Carney said he is still worried about the impact of Brexit on the economy.
Bonds
- The yield on 10-year Treasuries was little changed at 2.16 percent, after falling three basis points on Tuesday.
- Australian 10-year yields declined three basis points to 2.39 percent.
