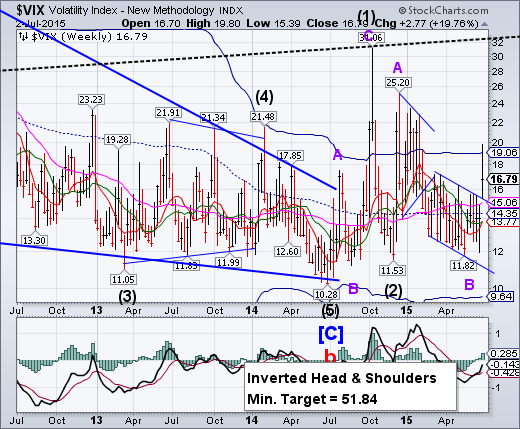
-- VIX gapped through its declining trendline, giving a confirmed sell signal for SPX. The rally has resumed with implications of a much higher outcome.
SPX challenges long-term support.
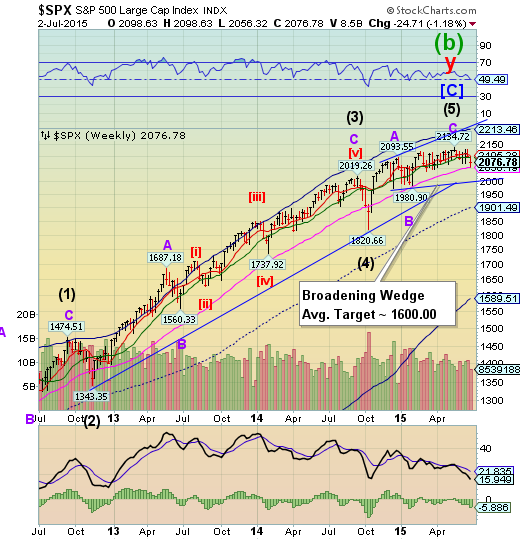
SPX challenged weekly long-term support at 2056.19, closing just above it. This leaves SPX on a confirmed sell signal and vulnerable to a drop to or below double trendlines near 2025.00 (also round number support at 2000.00). SPX may have had a Master Cycle low last week, suggesing that a failure to rally here may bring up to 4 months of decline.
(WSJ) Stocks ended slightly lower Thursday as an early rally ran out of steam, even after the U.S. jobs report reaffirmed investors’ belief that the Federal Reserve would be patient in raising interest rates.
The Dow Jones Industrial Average fell 27.80, or 0.2%, to 17730.11, reversing a gain of as much as 68 points earlier in the session. The S&P 500 index lost 0.64 point, less than 0.1%, to 2076.78. The Nasdaq Composite Index declined 3.91, or 0.1%, to 5009.21.
The Labor Department said 223,000 jobs were added to the U.S. economy in June, while the unemployment rate fell to 5.3% from 5.5%. The number of new jobs created came in just below expectations for 233,000, while wages remained flat.
NDX closes beneath intermediate-term support.
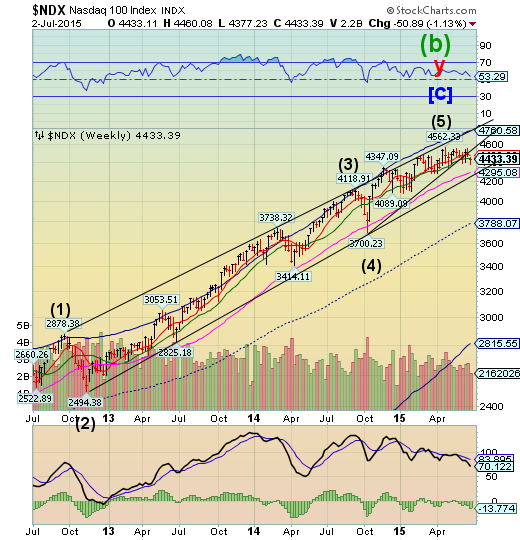
NDX closed beneath itsweekly Intermediate-term support at 4444.85 this week, giving NDX a confirmed sell signal as well. This implies a complete retracement to its October 15 low at 3700.23. The loss of additional supports alters the longer-term view. For example, the loss of the longer-term trendline at 4290.00 suggests a probable retracement to or beneath the origin of that trendline as well.
(ZeroHedge) Stock buybacks have been in the news lately, as their growing size has lead to criticism, especially from politicians who believe they contribute to economic inequality. But the simplest critique of the practice of buybacks can be made on economic grounds, in terms of value created or destroyed.
If you ask a seasoned investor to boil success down to one sentence, they’ll probably say “buy low and sell high.” Ask them to simplify even more, and they’ll say “buy value” – which usually correlates with buying something when its cheap. If we flip these maxims around then the worst kind of investing is to buy high. Expensive things do occasionally become more expensive – but with greater risk.
High Yield Bonds are making new lows.
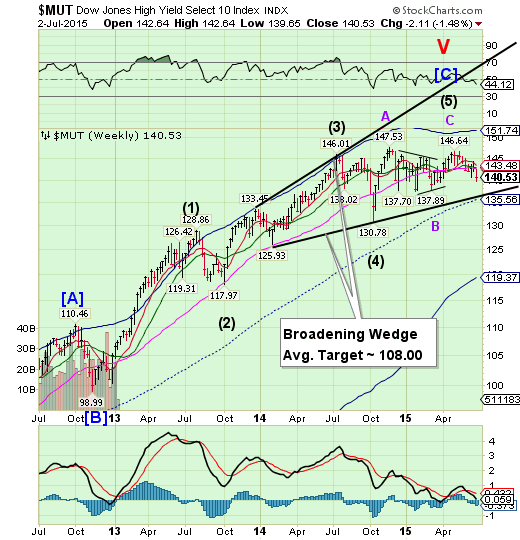
The High Yield Index continued its decline beneath all Model supports this week. It appears destined for the lower trendline of its Broadening Wedge formation. It may have had its Master Cycle low this week, suggesting that a failure to overcome overhead resistance may result in a very serious decline straight ahead. The financing of stock buybacks is being seriously threatened.
(MarketRealist) Investor flows in high yield bond funds returned to positive territory after witnessing outflows for two successive weeks. According to Lipper, net inflows totaled $622 million in the week ending June 26, compared with net outflows of $2.9 billion in the week ending June 19. On a year-to-date basis, high yield bond funds have witnessed inflows of $3.2 billion.
The euro loses Short-term support.
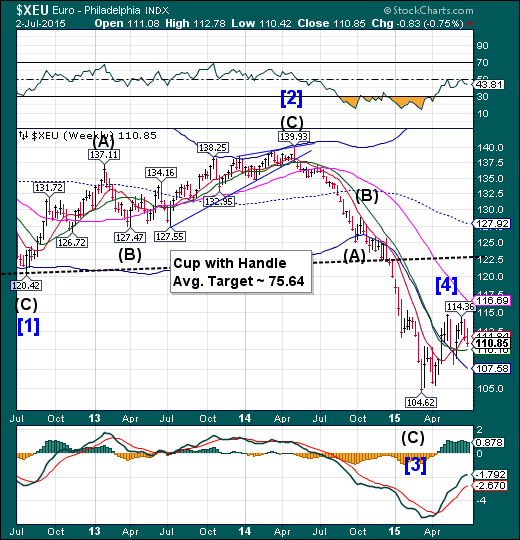
The euro closed beneath weekly Short-term support at 111.84 this week. This puts investors on high alert that the decline may be resuming. Should it decline beneath Intermediate-term support at 110.16 it may verify that it may be entering a period of weakness lasting for at least the next two weeks.
(ZeroHedge) The time to negotiate the Greek referendum this Sunday has come and gone and at this point, one can only sit and wait as the vote results start trickling in on Sunday evening. And, as Goldman's Huw Pill prudently observes, the outcome of Sunday's Greek referendum is uncertain. "Regardless of the outcome, Greece will continue to face substantial economic dislocation in the shorter term." What is interesting is that Goldman says "Greece will ultimately remain in the euro area even in the event of a ‘No’ vote."
Clearly, this together with the earlier IMF note, is great news for the Greek government, which can now point to not only the IMF backing its original claim that a debt haircut is absolutely necessary, but that none other than Mario Draghi's former boss, Goldman Sachs (NYSE:GS), agrees with Varoufakis that Greece will remain in the Eurozone even after a "No" vote
Euro Stoxx completes a right shoulder.
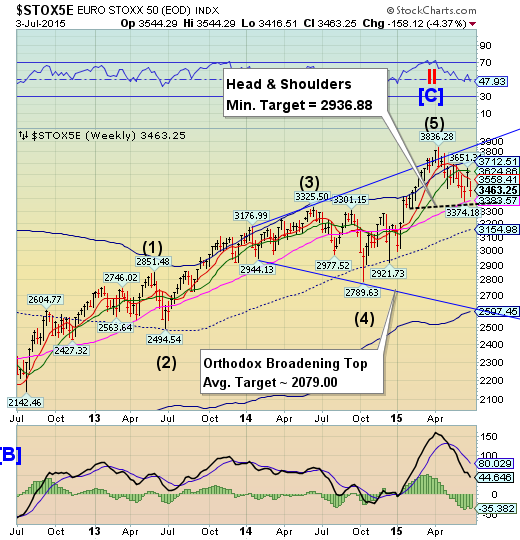
Euro Stoxx 50 completed what appears to be a right shoulder of a Head & Shoulders formation. It remainson a sell signal and breaking neckline support at weekly Long-term support at 3383.75. A panic declinemay ensue.
(BusinessInsider) London (AFP) - Europe's main stock markets slipped on Friday with all eyes on Greece's weekend referendum on its bailout and future place in the eurozone.
In late morning deals, Frankfurt's DAX 30 index lost 0.10 percent to stand at 11,088.73 points and in Paris the CAC 40 shed 0.21 percent to 4,825.18 amid fears of a "Grexit" or Greece exit from the single currency bloc.
Outside the eurozone, London's benchmark FTSE 100 index dipped 0.15 percent to 6,620.20 compared with Thursday's close.
The yen is attracting investor attention.
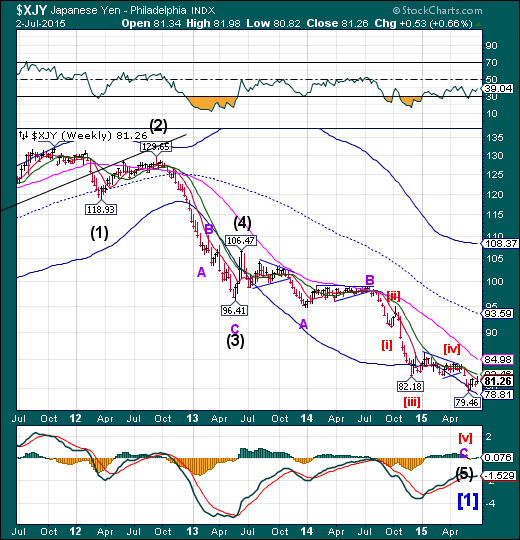
The yen appears to be advancing slowly, but remains beneath Short-term resistance at 81.56. A breakthrough at resistance may reveal a period of strength that may another week or so.
(EconomicTimes) The yen's rise to a five-week high this week against the backdrop of Greece's deepening debt crisis prompted more investors to use options to bet on or hedge against further near-term yen strength.
In early June, risk reversal spreads in dollar/yen options had favored yen puts - the right to sell the yen. But this week, they widened in favor of yen calls - the right to buy the yen - and reached their highest level in more than four months.
Risk reversals are not always a gauge of the market's directional expectations, as sometimes investors buy a call option to hedge a short position. But the fact that the yen also rose in spot trading suggests investors believe the Japanese currency could have further upside.
The Nikkei tests supports.
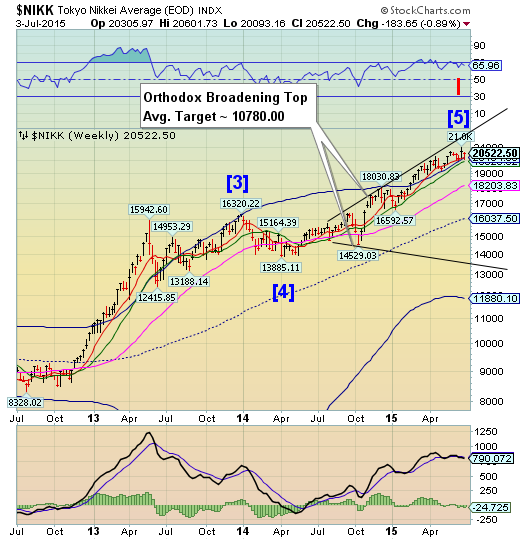
The Nikkei tested its weekly Short-term support and Cycle Top support at 20194.90. This appears to have all the elements of a reversal. Should the Nikkei decline beneath these levels, we may see a sharp decline through the better part of July follow.
(Reuters) Japan's Nikkei share average drifted lower on Friday as caution ahead of a Greek national vote over the weekend suppressed investors' appetite for risk, with Fast Retailing Co sliding after it reported a drop in domestic sales.
The Nikkei share average lost 0.4 percent to 20,431.25 by mid-morning, weighed down by Wall Street's tepid performance overnight after U.S. non-farm payrolls data that was not quite as strong as expected.
Still, a relatively calm view towards the pending Greek referendum limited the Nikkei's fall.
U.S. Dollar challenged Intermediate-term resistance.
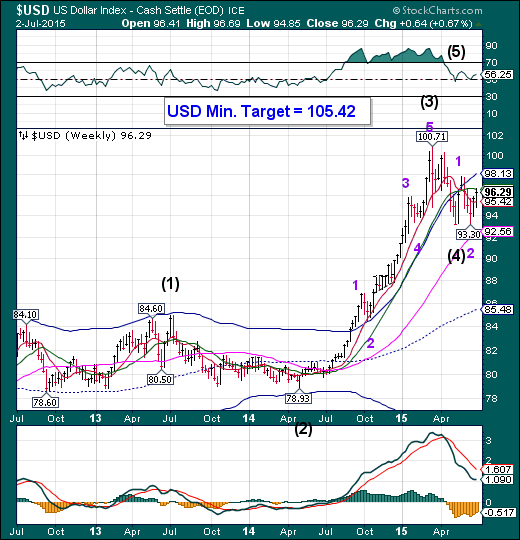
The US dollar challenged Intermediate-term resistance at 96.55 this week. This gives credence to the observation that the next probe higher is likely to break out above its Cycle Top resistance at 98.13. The Cycles appears to be positive through mid-July. There doesn’t seem to be much recognition by the media that the U.S. dollar is again gaining strength. It may take a breakout to get their attention again.
USB remains beneath Long-term support/resistance.
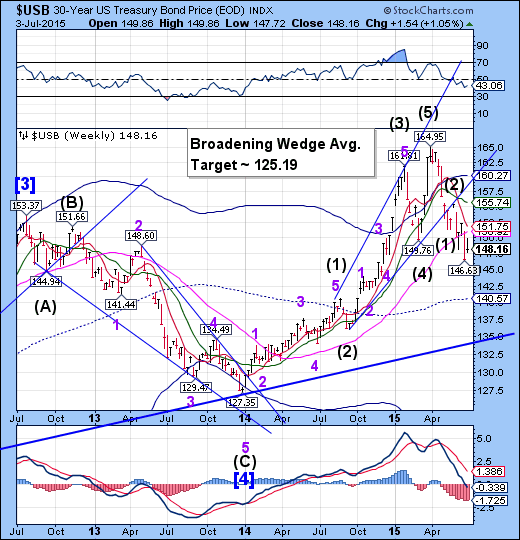
The Long Bond had an inside week as investors struggled with the news coming from Europe. Should European equities sell off, there may be a heavy flow toward Treasuries. .This may entail a rally as far as Cycle Top resistance at 155.74.
(WSJ) U.S. Treasury bonds rallied Thursday as a flat reading in U.S. wage inflation bolstered expectations that the Federal Reserve would remain patient in raising interest rates.
Investors also dialed back risks and parked cash into the haven debt market ahead of a referendum this Sunday in Greece on fresh bailout funding.
Greece’s debt crisis has generated wild swings in financial markets over the past few weeks amid concerns over potential knock-on effects on the stability of the eurozone’s financial system and the global economic outlook.
Gold may be headed for the Head & Shoulders neckline.
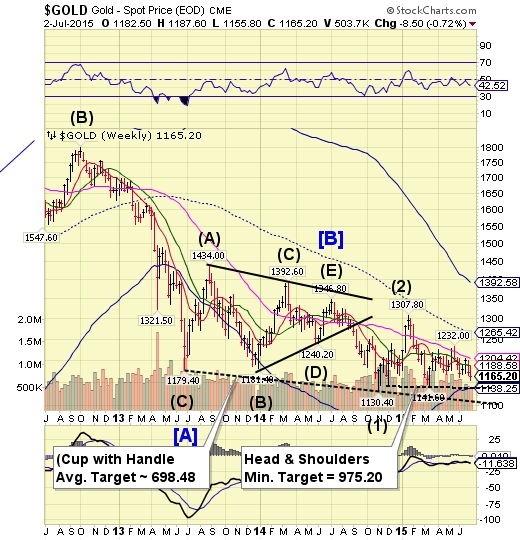
Gold continues to drift lower despite challenges to weekly Intermediate-term resistance at 1188.58. A probable decline beneath 1141.60 may develop, which may trigger the Head & Shoulders formation with a minimum target of 975.20. The Cycles Model now suggests a substantial low in late July.
(Forbes) Gold investors were beaten to a pulp as gold prices crashed to a five-year low this past week. Gold’s freefall from its 2011 peak has tarnished its reputation as a safe-haven asset. The yellow metal is supposed to outperform in the face of financial Armageddon, inflation, quantitative easing, massive deficit spending and anything else that could ail an economy. Gold is getting hammered despite infinite uncertainty surrounding the Greek debt crisis, China’s stock market collapse and political turmoil in Russia and Brazil.
The price of gold closed Friday at $1,168 an ounce with gold futures prices being nearly flat for the year. SPDR Gold Trust exchange-traded funds (ARCA:GLD) and iShares Gold Trust ETF (NYSE:IAU) – fell 1% through the end of second quarter. They lost 11% in the past year and 8.5% the past five years.
Crude begins to decline in earnest.
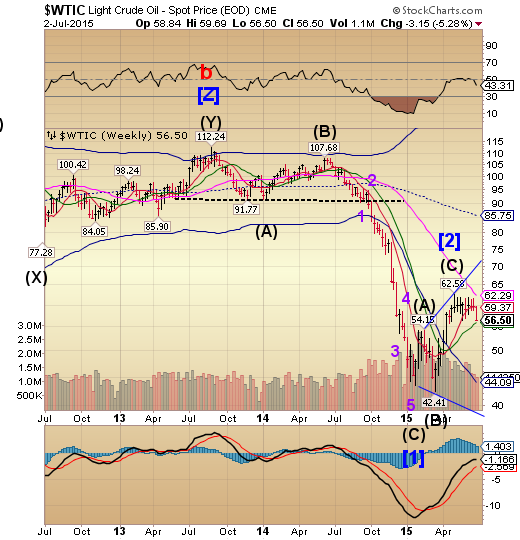
Crude declined to weekly Intermediate-term support/resistance at 55.87 after losing Short-term support. It is now time to be prepared for a massive decline into the third week of July once Intermediate-term support is lost.
(WSJ) The amount of rigs drilling for oil in the U.S. rose for the first time in seven months, triggering a slump in crude oil prices to their lowest settlement in two months.
U.S. oil producers added 12 rigs last week, breaking 29 straight weeks of cuts, in response to prices that have rebound to- and stayed at $60 a barrel since late April. That convinced producers to end months of massive cutbacks that started after the U.S. shale drilling boom flooded the market and sent prices crashing.
Shanghai Index suffers three weeks of decline.
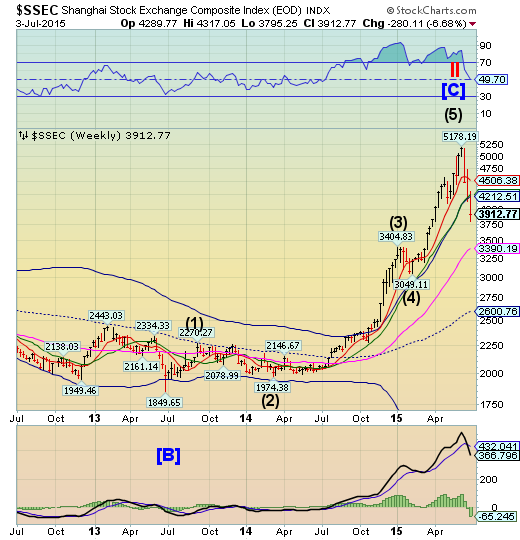
The Shanghai Index declined for a third week, closing beneath Intermediate-term support and its Cycle Top support/resistance at 4212.51. It now appears to be time for a bounce to challenge its Cycle Top. A retracement rally may develop, lasting up to three weeks.
(ZeroHedge) “The market is now a falling knife”, BofAML said on Friday, referring to the harrowing 30% decline in Chinese stocks that has unfolded over the course of just three weeks, leaving the PBoC and various other government agencies scrambling to arrest the slide.
Cuts to both policy rates (benchmark lending rate and RRR) and daily “remain calm” pronouncements by various government agencies have so far proven woefully inadequate to combat the country’s margin mania unwind, leaving BofA to conclude that the only thing which can help Chinese equities now is direct buying on the part of the government.
As a reminder, the problem here appears to be related to the hodge-podge of backdoor margin buying vehicles that have combined to channelbetween CNY500 billion and CNY1 trillion in unofficial, off-the-books margin lending into stocks via umbrella trusts, structured funds, P2P lending, and a variety of other mechanisms that allow China’s millions of newly-minted retail investors to skirt minimum balance requirements and margin limits at brokerages.
The Banking Index may have made its final high.
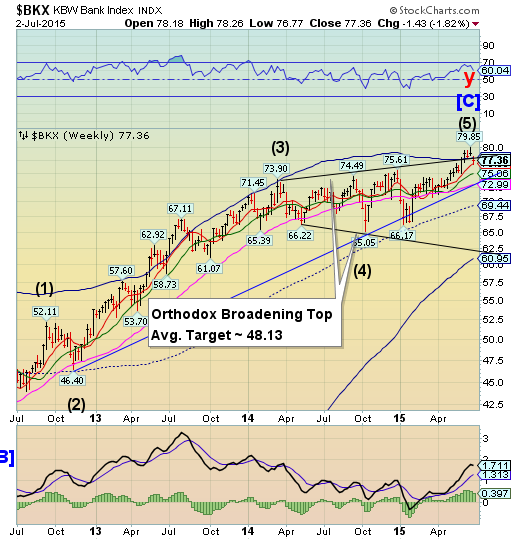
--BKX slipped beneath its upper trendline and Cycle Top support at 77.93, which produced a reversal pattern beneath resistance. The Cycles Model now implies that a further rally, if any, may last only a few days.
(Breitbart) A Financial Times report that Greek savers could lose 30 percent of their bank deposits to shore up their country’s banking system is a “malicious rumour,” Greek Finance Minister Yanis Varoufakis said Friday.
“FT report of a Gk (Greek) Bank Bail In is a malicious rumour that the Head of the Greek Banks Association denied this morning,” he tweeted.
The British business daily, quoting unidentified quoting bankers and businessmen close to negotiations, had reported that Greek depositors with over 8,000 euros ($8,900) in an account may be made to take a “haircut” similar to those taken by Cypriot account holders in 2013, when uninsured funds were seized to stabilise the financial sector.
(CNBC) Greece's embattled banks may have to extend their closing time beyond next week, depending on the result of a crucial vote on Sunday.
This week, Greek banks have been shut and citizens can only withdraw 60 euros ($67) a day from ATMs. Prime Minister Alexis Tsipras called a bank holiday late last Friday after announcing Sunday's referendum on a new fiscal program for Greece – a vote which for many has become a proxy decision on Greece's euro membership.
(ZeroHedge) On Monday, in “Beggar Thy Neighbor? Greece’s Battered Banks Beget Balkan Jitters,” we took an in depth look at the potential for the Greek banking crisis to infect Bulgaria, Romania, and Serbia, where Greek banks control a substantial percentage of total banking assets.
We noted that yields on the country’s bonds had spiked in the wake of capital controls in Greece and the ensuing ATM run, a reflection of souring investor sentiment despite assurances from local banking officials that there was no risk of similar measures being implemented outside of Greece.
“Any action by the Greek government and the central bank to impose measures in the Greek financial system have no legal force in Bulgaria and can in no way affect the smooth functioning and stability of the Bulgarian banking system," Bulgaria’s central bank said, in a statement.
